
Blogs
Blogs
Blogs
Read Our Blogs
Read Our Blogs
Read Our Blogs

Pillar Two's GloBE Rules and Their Interaction with Traditional Transfer Pricing
Pillar Two's GloBE Rules and Their Interaction with Traditional Transfer Pricing
Pillar Two's Global Anti-Base Erosion (GloBE) rules introduce a fifteen percent minimum effective tax rate for large multinational groups, computed on a jurisdiction-by-jurisdiction basis using a largely accounting-based methodology. Because that computation still starts from each entity's reported profit, which itself depends on the group's intercompany pricing, transfer pricing outcomes and GloBE top-up tax exposure are now structurally linked in a way earlier BEPS measures did not require groups to model together.
How GloBE Uses Transfer Pricing Outcomes
The GloBE effective tax rate calculation for a jurisdiction starts from the constituent entities' financial accounting net income, adjusted through a defined set of GloBE-specific adjustments, and that starting income figure is itself a direct product of the group's transfer pricing positions, since intercompany charges, royalties, and margins all flow straight into each entity's reported pre-tax profit. A transfer pricing adjustment that shifts profit from a high-tax to a low-tax jurisdiction, even where fully defensible under Chapter I, correspondingly shifts GloBE tax base between those same jurisdictions, potentially increasing top-up tax exposure in the low-tax jurisdiction the profit moves into.
The Consistency Requirement for Intragroup Transactions
The GloBE rules include a specific requirement that intragroup transactions be recorded consistently in both constituent entities' financial accounts at the same amount, and, notably, at an arm's length amount, for the transaction to be recognised as GloBE income and expense in the ordinary course. A transfer pricing position later adjusted by a tax authority in one jurisdiction, without a symmetrical adjustment recorded in the counterparty jurisdiction's accounts, can create a mismatch that the GloBE computation is specifically designed to catch and neutralise, effectively importing unresolved transfer pricing disputes directly into the minimum tax calculation.
Top-Up Tax Exposure from Aggressive TP Positions
A group that has historically shifted a meaningful share of profit into a low-tax jurisdiction through an aggressive, if technically defensible, transfer pricing position now faces a different economic consequence even where the position survives tax authority challenge in that jurisdiction: if the jurisdiction's effective tax rate on that profit sits below fifteen percent, GloBE top-up tax claws back the difference regardless of the local statutory rate or any local incentive that produced the low effective rate in the first place. This substantially reduces the incentive that historically drove aggressive profit allocation into low-tax jurisdictions.
Rethinking TP Positions Under a Minimum Tax Floor
Where a group's effective tax rate in a given jurisdiction is already at or above fifteen percent after GloBE adjustments, shifting additional profit into that jurisdiction through a more conservative transfer pricing position, for instance retaining a larger routine return locally rather than pushing residual profit to a principal entity elsewhere, may no longer carry the same GloBE-related downside it would in a genuinely low-tax jurisdiction, changing the calculus groups apply when weighing aggressive versus conservative TP positions across their footprint.
Coordinating the TP and Pillar Two Compliance Functions
Because GloBE computations and transfer pricing positions are now this tightly coupled, groups that continue to run TP planning and Pillar Two compliance as separate workstreams, prepared by different teams on different timelines, risk optimising one at the expense of the other, defending a transfer pricing position that is technically sound in isolation while generating an unanticipated top-up tax liability the TP team never modelled. Building a single integrated review, testing proposed TP positions against their GloBE effective tax rate impact before they are implemented, is becoming a standard expectation for groups within Pillar Two's scope.
Conclusion
GloBE's accounting-based effective tax rate calculation means every transfer pricing position a group takes now has a direct and quantifiable minimum-tax consequence, not merely a conventional TP audit risk, and the two can no longer be assessed independently. Groups within Pillar Two's scope should model the GloBE effective tax rate impact of any material transfer pricing restructuring before implementation, rather than treating minimum tax exposure as a separate compliance workstream to be reconciled after the fact.
Pillar Two's Global Anti-Base Erosion (GloBE) rules introduce a fifteen percent minimum effective tax rate for large multinational groups, computed on a jurisdiction-by-jurisdiction basis using a largely accounting-based methodology. Because that computation still starts from each entity's reported profit, which itself depends on the group's intercompany pricing, transfer pricing outcomes and GloBE top-up tax exposure are now structurally linked in a way earlier BEPS measures did not require groups to model together.
How GloBE Uses Transfer Pricing Outcomes
The GloBE effective tax rate calculation for a jurisdiction starts from the constituent entities' financial accounting net income, adjusted through a defined set of GloBE-specific adjustments, and that starting income figure is itself a direct product of the group's transfer pricing positions, since intercompany charges, royalties, and margins all flow straight into each entity's reported pre-tax profit. A transfer pricing adjustment that shifts profit from a high-tax to a low-tax jurisdiction, even where fully defensible under Chapter I, correspondingly shifts GloBE tax base between those same jurisdictions, potentially increasing top-up tax exposure in the low-tax jurisdiction the profit moves into.
The Consistency Requirement for Intragroup Transactions
The GloBE rules include a specific requirement that intragroup transactions be recorded consistently in both constituent entities' financial accounts at the same amount, and, notably, at an arm's length amount, for the transaction to be recognised as GloBE income and expense in the ordinary course. A transfer pricing position later adjusted by a tax authority in one jurisdiction, without a symmetrical adjustment recorded in the counterparty jurisdiction's accounts, can create a mismatch that the GloBE computation is specifically designed to catch and neutralise, effectively importing unresolved transfer pricing disputes directly into the minimum tax calculation.
Top-Up Tax Exposure from Aggressive TP Positions
A group that has historically shifted a meaningful share of profit into a low-tax jurisdiction through an aggressive, if technically defensible, transfer pricing position now faces a different economic consequence even where the position survives tax authority challenge in that jurisdiction: if the jurisdiction's effective tax rate on that profit sits below fifteen percent, GloBE top-up tax claws back the difference regardless of the local statutory rate or any local incentive that produced the low effective rate in the first place. This substantially reduces the incentive that historically drove aggressive profit allocation into low-tax jurisdictions.
Rethinking TP Positions Under a Minimum Tax Floor
Where a group's effective tax rate in a given jurisdiction is already at or above fifteen percent after GloBE adjustments, shifting additional profit into that jurisdiction through a more conservative transfer pricing position, for instance retaining a larger routine return locally rather than pushing residual profit to a principal entity elsewhere, may no longer carry the same GloBE-related downside it would in a genuinely low-tax jurisdiction, changing the calculus groups apply when weighing aggressive versus conservative TP positions across their footprint.
Coordinating the TP and Pillar Two Compliance Functions
Because GloBE computations and transfer pricing positions are now this tightly coupled, groups that continue to run TP planning and Pillar Two compliance as separate workstreams, prepared by different teams on different timelines, risk optimising one at the expense of the other, defending a transfer pricing position that is technically sound in isolation while generating an unanticipated top-up tax liability the TP team never modelled. Building a single integrated review, testing proposed TP positions against their GloBE effective tax rate impact before they are implemented, is becoming a standard expectation for groups within Pillar Two's scope.
Conclusion
GloBE's accounting-based effective tax rate calculation means every transfer pricing position a group takes now has a direct and quantifiable minimum-tax consequence, not merely a conventional TP audit risk, and the two can no longer be assessed independently. Groups within Pillar Two's scope should model the GloBE effective tax rate impact of any material transfer pricing restructuring before implementation, rather than treating minimum tax exposure as a separate compliance workstream to be reconciled after the fact.
Read More

Thin Capitalisation and Section 94B: Where the Interest Limitation Rule Meets Transfer Pricing
Thin Capitalisation and Section 94B: Where the Interest Limitation Rule Meets Transfer Pricing
An intercompany loan can be priced at a perfectly defensible arm's length interest rate under conventional transfer pricing analysis and still have a portion of that interest disallowed as a tax deduction, because thin capitalisation and interest limitation rules operate as a separate statutory ceiling layered on top of, not instead of, the arm's length pricing requirement. India's Section 94B, implementing the BEPS Action 4 framework, is the clearest illustration of how the two regimes interact and sometimes collide.
What Section 94B Actually Limits
Section 94B caps the deduction for interest or similar consideration paid or payable to an associated enterprise, or to a third party where an associated enterprise provides an implicit or explicit guarantee, at thirty percent of the borrowing entity's EBITDA, or the actual interest expense, whichever is lower, for Indian companies whose interest expense to an associated enterprise exceeds the prescribed threshold, currently one crore rupees. Interest disallowed in a given year can generally be carried forward and set off against future years' permissible interest deduction limit, subject to a statutory time cap.
Why an Arm's Length Rate Doesn't Guarantee Full Deductibility
The two regimes ask genuinely different questions. Transfer pricing under Section 92 asks whether the interest rate itself reflects what an independent lender would have charged, given the borrower's credit profile and the loan's terms. Section 94B asks a separate, EBITDA-based leverage question entirely: regardless of whether the rate is arm's length, is the borrowing entity's total related-party interest burden proportionate to its earnings capacity. A loan priced at an impeccably benchmarked arm's length rate can still trigger a Section 94B disallowance if the borrower is carrying more related-party debt than its EBITDA can support under the statutory ratio.
The Guarantee Extension
Section 94B's reach extends beyond direct related-party loans to third-party debt that an associated enterprise implicitly or explicitly guarantees, or where a matching deposit or comparable arrangement effectively passes the credit risk of a nominally independent loan back to the group. This anti-avoidance extension means groups cannot simply route related-party financing through an ostensibly third-party lender, backed by a group guarantee, to escape the EBITDA-based cap, a structure the provision was specifically designed to catch.
Interaction with the Loan's Standalone Credit Rating
Because Section 94B's cap operates independently of the loan's arm's length interest rate, groups modelling the true cost of intercompany debt need to run both analyses together: the credit-rating notching and comparable-instrument benchmarking exercise that establishes the arm's length rate under conventional TP methodology, and a separate EBITDA-based leverage test to confirm the resulting interest expense will actually be deductible. A financing structure optimised purely for arm's length rate defensibility, without regard to the borrower's resulting interest-to-EBITDA ratio, can still generate a substantial non-deductible interest cost.
Structuring Around the Limitation
Where a borrowing entity's projected related-party interest burden approaches or exceeds the thirty percent EBITDA threshold, groups typically consider a mix of responses: reducing related-party debt levels in favour of equity or third-party financing not subject to the same guarantee-linked extension, restructuring loan tenor and repayment profiles to smooth the annual interest charge, or accepting the disallowance and tracking the carry-forward against the entity's projected future EBITDA growth. Each option carries its own transfer pricing and commercial trade-offs that need to be modelled against the entity's specific financial trajectory rather than applied as a generic template.
Conclusion
Section 94B operates as an independent statutory overlay on top of conventional interest-rate transfer pricing, not a restatement of it, and a fully defensible arm's length rate provides no protection against an EBITDA-based leverage disallowance. Groups financing Indian subsidiaries through related-party debt should model the interest limitation exposure alongside the credit-rating and rate benchmarking exercise, as a single combined financing analysis, rather than as two sequential and unconnected compliance steps.
An intercompany loan can be priced at a perfectly defensible arm's length interest rate under conventional transfer pricing analysis and still have a portion of that interest disallowed as a tax deduction, because thin capitalisation and interest limitation rules operate as a separate statutory ceiling layered on top of, not instead of, the arm's length pricing requirement. India's Section 94B, implementing the BEPS Action 4 framework, is the clearest illustration of how the two regimes interact and sometimes collide.
What Section 94B Actually Limits
Section 94B caps the deduction for interest or similar consideration paid or payable to an associated enterprise, or to a third party where an associated enterprise provides an implicit or explicit guarantee, at thirty percent of the borrowing entity's EBITDA, or the actual interest expense, whichever is lower, for Indian companies whose interest expense to an associated enterprise exceeds the prescribed threshold, currently one crore rupees. Interest disallowed in a given year can generally be carried forward and set off against future years' permissible interest deduction limit, subject to a statutory time cap.
Why an Arm's Length Rate Doesn't Guarantee Full Deductibility
The two regimes ask genuinely different questions. Transfer pricing under Section 92 asks whether the interest rate itself reflects what an independent lender would have charged, given the borrower's credit profile and the loan's terms. Section 94B asks a separate, EBITDA-based leverage question entirely: regardless of whether the rate is arm's length, is the borrowing entity's total related-party interest burden proportionate to its earnings capacity. A loan priced at an impeccably benchmarked arm's length rate can still trigger a Section 94B disallowance if the borrower is carrying more related-party debt than its EBITDA can support under the statutory ratio.
The Guarantee Extension
Section 94B's reach extends beyond direct related-party loans to third-party debt that an associated enterprise implicitly or explicitly guarantees, or where a matching deposit or comparable arrangement effectively passes the credit risk of a nominally independent loan back to the group. This anti-avoidance extension means groups cannot simply route related-party financing through an ostensibly third-party lender, backed by a group guarantee, to escape the EBITDA-based cap, a structure the provision was specifically designed to catch.
Interaction with the Loan's Standalone Credit Rating
Because Section 94B's cap operates independently of the loan's arm's length interest rate, groups modelling the true cost of intercompany debt need to run both analyses together: the credit-rating notching and comparable-instrument benchmarking exercise that establishes the arm's length rate under conventional TP methodology, and a separate EBITDA-based leverage test to confirm the resulting interest expense will actually be deductible. A financing structure optimised purely for arm's length rate defensibility, without regard to the borrower's resulting interest-to-EBITDA ratio, can still generate a substantial non-deductible interest cost.
Structuring Around the Limitation
Where a borrowing entity's projected related-party interest burden approaches or exceeds the thirty percent EBITDA threshold, groups typically consider a mix of responses: reducing related-party debt levels in favour of equity or third-party financing not subject to the same guarantee-linked extension, restructuring loan tenor and repayment profiles to smooth the annual interest charge, or accepting the disallowance and tracking the carry-forward against the entity's projected future EBITDA growth. Each option carries its own transfer pricing and commercial trade-offs that need to be modelled against the entity's specific financial trajectory rather than applied as a generic template.
Conclusion
Section 94B operates as an independent statutory overlay on top of conventional interest-rate transfer pricing, not a restatement of it, and a fully defensible arm's length rate provides no protection against an EBITDA-based leverage disallowance. Groups financing Indian subsidiaries through related-party debt should model the interest limitation exposure alongside the credit-rating and rate benchmarking exercise, as a single combined financing analysis, rather than as two sequential and unconnected compliance steps.
Read More

Cross-Border Employee Secondments: Where Transfer Pricing Meets Permanent Establishment Risk
Cross-Border Employee Secondments: Where Transfer Pricing Meets Permanent Establishment Risk
Seconding an employee from one group entity to another across a border is operationally routine, filling a skills gap, transferring specialist expertise, supporting a new market entry, but it sits at the intersection of two distinct tax exposures that are too often analysed separately: whether the intercompany recharge for the seconded employee's cost is priced at arm's length, and whether the secondment itself creates a permanent establishment for the sending entity in the host country.
Pricing the Secondment Charge
The transfer pricing question is comparatively straightforward in principle: the host entity should be charged an amount reflecting the arm's length value of the services the seconded employee actually performs there, which is not necessarily the same as a simple pass-through of the employee's salary, social security, and benefits cost. Where the seconded employee performs functions of genuine value to the host entity beyond a routine administrative role, a markup on the recharged cost, rather than a bare cost pass-through, is typically required to reflect the value of the service being provided, not merely the cost of employing the individual.
Who the Employee Is Actually Working For
A recurring complication is determining whether the seconded employee, during the secondment period, is genuinely working under the direction and control of the host entity, in which case the arrangement functions economically like a service provided by the sending entity, or has effectively become integrated into the host entity's own operations as if directly employed there, in which case the appropriate characterisation, and the appropriate charge, may look quite different. Employment contracts, day-to-day reporting lines, and who bears the economic risk of the employee's work each inform this characterisation.
The Dependent Agent Permanent Establishment Risk
Separately from pricing, a seconded employee who habitually concludes contracts, or plays the principal role leading to the routine conclusion of contracts, on behalf of the sending entity in the host country can create a dependent agent permanent establishment for the sending entity there, exposing it to host-country corporate tax on the profits attributable to that PE under the AOA framework, regardless of how the secondment recharge itself is priced. This risk is entirely independent of, and additional to, the transfer pricing exposure on the recharge, and groups frequently focus on one while overlooking the other.
The Fixed Place of Business Risk
Beyond dependent agency, a secondment can also create a fixed place of business PE where the seconded employee, working from the host entity's premises over a sustained period, is found to be carrying on the sending entity's own business there, rather than genuinely working for and under the direction of the host entity. Distinguishing a genuine service secondment from an arrangement that in substance places the sending entity's own business operations inside the host country requires a careful, fact-specific analysis of direction, control, and whose business risk the employee's work actually serves.
Structuring and Documenting the Secondment
A well-structured secondment agreement should specify clearly who directs and supervises the employee's day-to-day work, who bears the commercial risk and reward of the work performed, how the recharge is calculated and whether it includes a markup, and the expected duration of the arrangement, since duration itself is a relevant factor in both the PE analysis and in assessing whether the secondment is a genuine temporary service arrangement rather than a de facto permanent relocation of the sending entity's function to the host country.
Conclusion
Secondment structuring cannot be treated as a pure transfer pricing pricing exercise; the PE risk created by where the seconded employee actually works, who directs them, and what authority they exercise runs alongside the arm's length recharge question and needs its own independent analysis. Groups with material secondment volumes should review both exposures together as part of the same structuring exercise, rather than pricing the recharge correctly while leaving the PE question unexamined.
Seconding an employee from one group entity to another across a border is operationally routine, filling a skills gap, transferring specialist expertise, supporting a new market entry, but it sits at the intersection of two distinct tax exposures that are too often analysed separately: whether the intercompany recharge for the seconded employee's cost is priced at arm's length, and whether the secondment itself creates a permanent establishment for the sending entity in the host country.
Pricing the Secondment Charge
The transfer pricing question is comparatively straightforward in principle: the host entity should be charged an amount reflecting the arm's length value of the services the seconded employee actually performs there, which is not necessarily the same as a simple pass-through of the employee's salary, social security, and benefits cost. Where the seconded employee performs functions of genuine value to the host entity beyond a routine administrative role, a markup on the recharged cost, rather than a bare cost pass-through, is typically required to reflect the value of the service being provided, not merely the cost of employing the individual.
Who the Employee Is Actually Working For
A recurring complication is determining whether the seconded employee, during the secondment period, is genuinely working under the direction and control of the host entity, in which case the arrangement functions economically like a service provided by the sending entity, or has effectively become integrated into the host entity's own operations as if directly employed there, in which case the appropriate characterisation, and the appropriate charge, may look quite different. Employment contracts, day-to-day reporting lines, and who bears the economic risk of the employee's work each inform this characterisation.
The Dependent Agent Permanent Establishment Risk
Separately from pricing, a seconded employee who habitually concludes contracts, or plays the principal role leading to the routine conclusion of contracts, on behalf of the sending entity in the host country can create a dependent agent permanent establishment for the sending entity there, exposing it to host-country corporate tax on the profits attributable to that PE under the AOA framework, regardless of how the secondment recharge itself is priced. This risk is entirely independent of, and additional to, the transfer pricing exposure on the recharge, and groups frequently focus on one while overlooking the other.
The Fixed Place of Business Risk
Beyond dependent agency, a secondment can also create a fixed place of business PE where the seconded employee, working from the host entity's premises over a sustained period, is found to be carrying on the sending entity's own business there, rather than genuinely working for and under the direction of the host entity. Distinguishing a genuine service secondment from an arrangement that in substance places the sending entity's own business operations inside the host country requires a careful, fact-specific analysis of direction, control, and whose business risk the employee's work actually serves.
Structuring and Documenting the Secondment
A well-structured secondment agreement should specify clearly who directs and supervises the employee's day-to-day work, who bears the commercial risk and reward of the work performed, how the recharge is calculated and whether it includes a markup, and the expected duration of the arrangement, since duration itself is a relevant factor in both the PE analysis and in assessing whether the secondment is a genuine temporary service arrangement rather than a de facto permanent relocation of the sending entity's function to the host country.
Conclusion
Secondment structuring cannot be treated as a pure transfer pricing pricing exercise; the PE risk created by where the seconded employee actually works, who directs them, and what authority they exercise runs alongside the arm's length recharge question and needs its own independent analysis. Groups with material secondment volumes should review both exposures together as part of the same structuring exercise, rather than pricing the recharge correctly while leaving the PE question unexamined.
Read More

Captive Insurance and Reinsurance: Pricing Intra-Group Risk Transfer
Captive Insurance and Reinsurance: Pricing Intra-Group Risk Transfer
Groups that self-insure through a captive insurance or reinsurance subsidiary create one of the most functionally scrutinised categories of intra-group financial transaction, since a captive that merely re-labels a parental guarantee as an insurance premium, without genuine risk pooling, diversification, or underwriting substance, will not be respected as insurance for transfer pricing purposes regardless of its regulatory licence.
What Distinguishes Genuine Insurance from a Disguised Guarantee
The OECD's financial transactions guidance sets out specific indicators of genuine insurance risk: the arrangement must involve risk diversification and pooling, consistent with how an independent insurer manages a portfolio of risks rather than a single concentrated exposure; the captive must be regulated as an insurer in its jurisdiction of operation; and the pricing must reflect a level of risk assumption genuinely comparable to independent commercial insurance, not merely a mechanism to reroute profit into a low-tax captive with no meaningful underwriting function.
Diversification Benefit and Portfolio Effects
A key economic feature of insurance is that pooling many independent risks reduces the insurer's overall variance relative to the sum of the individual risks, a genuine diversification benefit that increasingly disappears where a captive insures only, or predominantly, the risks of its own parent group, since those risks are frequently correlated with each other rather than independent. Where a captive's book consists overwhelmingly of a single group's risks, tax authorities scrutinise closely whether it is genuinely providing a diversification benefit at all, or functioning instead as a pass-through vehicle.
Benchmarking Premium Pricing
Where a captive is found to have genuine insurance substance, its premiums are benchmarked using actuarial pricing techniques, informed by the expected loss the captive is underwriting, a risk margin, and an expense loading, cross-checked where possible against comparable premiums quoted by independent commercial insurers for similar risks, adjusted for differences in policy terms, deductibles, and coverage limits. Pure CUP comparisons to commercial market premiums are often imperfect because the captive's risk pool, terms, and claims history rarely match a public insurer's precisely, which makes the actuarial cross-check an important complement rather than an optional extra.
Retrocession and Fronting Arrangements
Many captives retrocede, reinsure onward, a substantial portion of the risk they nominally assume to third-party reinsurers, and where retrocession levels are very high, the captive's own retained risk, and therefore its claim to a meaningful underwriting margin, can look thin. Similarly, fronting arrangements, where an independent insurer issues the policy and immediately reinsures the risk to the group's captive, need the fronting insurer's fee and the captive's assumed risk both tested separately, since the fronting fee and the reinsurance premium are two distinct transactions each requiring its own arm's length justification.
Capital Adequacy as a Transfer Pricing Input
Consistent with the broader financial transactions framework's emphasis on capital supporting assumed risk, a captive needs to hold capital commensurate with the risk it genuinely retains, benchmarked against the solvency capital standards applicable to comparable independent insurers in its regulatory jurisdiction. An undercapitalised captive retaining a large notional risk exposure is a strong indicator that the true economic risk sits elsewhere in the group, typically with the parent providing implicit or explicit support, which in turn undermines the captive's claim to the full underwriting margin its stated premiums would otherwise justify.
Conclusion
A captive insurance arrangement is only respected for transfer pricing purposes to the extent it demonstrates genuine risk diversification, adequate capitalisation, and actuarially grounded pricing, not merely a regulatory insurance licence layered over what is economically a parental risk-absorption mechanism. Groups operating captives should periodically test their retrocession ratios, capital adequacy, and risk-pool concentration against these substance indicators, well before a tax authority runs the same test during an audit.
Groups that self-insure through a captive insurance or reinsurance subsidiary create one of the most functionally scrutinised categories of intra-group financial transaction, since a captive that merely re-labels a parental guarantee as an insurance premium, without genuine risk pooling, diversification, or underwriting substance, will not be respected as insurance for transfer pricing purposes regardless of its regulatory licence.
What Distinguishes Genuine Insurance from a Disguised Guarantee
The OECD's financial transactions guidance sets out specific indicators of genuine insurance risk: the arrangement must involve risk diversification and pooling, consistent with how an independent insurer manages a portfolio of risks rather than a single concentrated exposure; the captive must be regulated as an insurer in its jurisdiction of operation; and the pricing must reflect a level of risk assumption genuinely comparable to independent commercial insurance, not merely a mechanism to reroute profit into a low-tax captive with no meaningful underwriting function.
Diversification Benefit and Portfolio Effects
A key economic feature of insurance is that pooling many independent risks reduces the insurer's overall variance relative to the sum of the individual risks, a genuine diversification benefit that increasingly disappears where a captive insures only, or predominantly, the risks of its own parent group, since those risks are frequently correlated with each other rather than independent. Where a captive's book consists overwhelmingly of a single group's risks, tax authorities scrutinise closely whether it is genuinely providing a diversification benefit at all, or functioning instead as a pass-through vehicle.
Benchmarking Premium Pricing
Where a captive is found to have genuine insurance substance, its premiums are benchmarked using actuarial pricing techniques, informed by the expected loss the captive is underwriting, a risk margin, and an expense loading, cross-checked where possible against comparable premiums quoted by independent commercial insurers for similar risks, adjusted for differences in policy terms, deductibles, and coverage limits. Pure CUP comparisons to commercial market premiums are often imperfect because the captive's risk pool, terms, and claims history rarely match a public insurer's precisely, which makes the actuarial cross-check an important complement rather than an optional extra.
Retrocession and Fronting Arrangements
Many captives retrocede, reinsure onward, a substantial portion of the risk they nominally assume to third-party reinsurers, and where retrocession levels are very high, the captive's own retained risk, and therefore its claim to a meaningful underwriting margin, can look thin. Similarly, fronting arrangements, where an independent insurer issues the policy and immediately reinsures the risk to the group's captive, need the fronting insurer's fee and the captive's assumed risk both tested separately, since the fronting fee and the reinsurance premium are two distinct transactions each requiring its own arm's length justification.
Capital Adequacy as a Transfer Pricing Input
Consistent with the broader financial transactions framework's emphasis on capital supporting assumed risk, a captive needs to hold capital commensurate with the risk it genuinely retains, benchmarked against the solvency capital standards applicable to comparable independent insurers in its regulatory jurisdiction. An undercapitalised captive retaining a large notional risk exposure is a strong indicator that the true economic risk sits elsewhere in the group, typically with the parent providing implicit or explicit support, which in turn undermines the captive's claim to the full underwriting margin its stated premiums would otherwise justify.
Conclusion
A captive insurance arrangement is only respected for transfer pricing purposes to the extent it demonstrates genuine risk diversification, adequate capitalisation, and actuarially grounded pricing, not merely a regulatory insurance licence layered over what is economically a parental risk-absorption mechanism. Groups operating captives should periodically test their retrocession ratios, capital adequacy, and risk-pool concentration against these substance indicators, well before a tax authority runs the same test during an audit.
Read More

Transfer Pricing for Global Trading Desks and Financial Products
Transfer Pricing for Global Trading Desks and Financial Products
A multinational bank or trading group that runs an integrated, twenty-four-hour trading operation across multiple booking locations presents a transfer pricing problem conventional distributor or manufacturer benchmarking was never designed to solve. Global trading arrangements, where risk is originated in one location, managed in another, and booked in a third, require their own specialised framework, addressed in the OECD's dedicated global trading guidance alongside the general financial transactions chapter.
The Integrated Trading Model
In a fully integrated global trading operation, a single book of positions may be passed between trading desks in different time zones over the course of a day, with risk genuinely managed on a continuous, location-independent basis rather than sitting statically with whichever entity happens to hold the position at any given moment. This integration is precisely what makes conventional transaction-by-transaction benchmarking difficult, since the economically meaningful unit of analysis is often the trading function as a whole, not any single booked trade viewed in isolation.
Risk Origination, Risk Management, and Risk Assumption
The central functional question is which entity, and more specifically which personnel, actually originates a trading risk, actively manages it thereafter, and ultimately bears the economic consequence of it, since these three roles can sit in three different locations within an integrated desk structure. Consistent with the AOA and Chapter I risk-control principles more broadly, the entity or PE where the significant people functions managing the risk are genuinely located is generally attributed the greater share of the resulting trading profit, regardless of where the position happens to be legally booked.
The Two Main Pricing Approaches
Global trading profit is typically split using either a transactional profit split method, dividing combined trading profit based on the relative value of the risk-origination and risk-management contributions of each location, or a two-sided pricing approach that separately prices the risk-origination function through one method and the ongoing risk-management function through another, then reconciles the two. The choice between them depends heavily on how integrated the specific trading book is, highly integrated books with continuous risk hand-offs generally favour profit split, while more discrete trading functions can sometimes be priced on a more transactional basis.
Booking Location Versus Economic Substance
Tax authorities scrutinising global trading structures focus heavily on whether the booking location, the entity whose balance sheet legally reflects the position, has any genuine trading substance, dedicated trading personnel with real authority to manage the position, or is instead a purely administrative booking point receiving a disproportionate share of profit relative to its actual functional contribution. A booking entity with minimal trading headcount relative to the profit volume passing through it is one of the most consistent audit triggers in this sector globally.
Derivatives, Hedging, and Product-Specific Complications
Beyond the desk-level risk allocation question, individual financial products, interest rate swaps, structured derivatives, and internal hedging arrangements between group entities, each raise their own pricing questions, since internal hedges in particular need to be tested for whether they reflect a genuine risk transfer or merely an internal accounting convenience with no real economic substance, a distinction that closely parallels the broader Chapter X guidance on the accurate delineation of intra-group financial transactions.
Conclusion
Global trading transfer pricing ultimately reduces to the same significant-people-functions and risk-control analysis that underlies the AOA and Chapter I more broadly, applied to a business where risk genuinely moves across locations within a single trading day. Groups running integrated trading operations should map risk origination and management to actual personnel location before defaulting to a booking-location-based profit split, since booking location alone rarely survives a functional substance challenge.
A multinational bank or trading group that runs an integrated, twenty-four-hour trading operation across multiple booking locations presents a transfer pricing problem conventional distributor or manufacturer benchmarking was never designed to solve. Global trading arrangements, where risk is originated in one location, managed in another, and booked in a third, require their own specialised framework, addressed in the OECD's dedicated global trading guidance alongside the general financial transactions chapter.
The Integrated Trading Model
In a fully integrated global trading operation, a single book of positions may be passed between trading desks in different time zones over the course of a day, with risk genuinely managed on a continuous, location-independent basis rather than sitting statically with whichever entity happens to hold the position at any given moment. This integration is precisely what makes conventional transaction-by-transaction benchmarking difficult, since the economically meaningful unit of analysis is often the trading function as a whole, not any single booked trade viewed in isolation.
Risk Origination, Risk Management, and Risk Assumption
The central functional question is which entity, and more specifically which personnel, actually originates a trading risk, actively manages it thereafter, and ultimately bears the economic consequence of it, since these three roles can sit in three different locations within an integrated desk structure. Consistent with the AOA and Chapter I risk-control principles more broadly, the entity or PE where the significant people functions managing the risk are genuinely located is generally attributed the greater share of the resulting trading profit, regardless of where the position happens to be legally booked.
The Two Main Pricing Approaches
Global trading profit is typically split using either a transactional profit split method, dividing combined trading profit based on the relative value of the risk-origination and risk-management contributions of each location, or a two-sided pricing approach that separately prices the risk-origination function through one method and the ongoing risk-management function through another, then reconciles the two. The choice between them depends heavily on how integrated the specific trading book is, highly integrated books with continuous risk hand-offs generally favour profit split, while more discrete trading functions can sometimes be priced on a more transactional basis.
Booking Location Versus Economic Substance
Tax authorities scrutinising global trading structures focus heavily on whether the booking location, the entity whose balance sheet legally reflects the position, has any genuine trading substance, dedicated trading personnel with real authority to manage the position, or is instead a purely administrative booking point receiving a disproportionate share of profit relative to its actual functional contribution. A booking entity with minimal trading headcount relative to the profit volume passing through it is one of the most consistent audit triggers in this sector globally.
Derivatives, Hedging, and Product-Specific Complications
Beyond the desk-level risk allocation question, individual financial products, interest rate swaps, structured derivatives, and internal hedging arrangements between group entities, each raise their own pricing questions, since internal hedges in particular need to be tested for whether they reflect a genuine risk transfer or merely an internal accounting convenience with no real economic substance, a distinction that closely parallels the broader Chapter X guidance on the accurate delineation of intra-group financial transactions.
Conclusion
Global trading transfer pricing ultimately reduces to the same significant-people-functions and risk-control analysis that underlies the AOA and Chapter I more broadly, applied to a business where risk genuinely moves across locations within a single trading day. Groups running integrated trading operations should map risk origination and management to actual personnel location before defaulting to a booking-location-based profit split, since booking location alone rarely survives a functional substance challenge.
Read More

Head Office Expenses and Stewardship Costs: Drawing the Chargeable Line
Head Office Expenses and Stewardship Costs: Drawing the Chargeable Line
Every multinational group incurs central costs, executive management, group-wide finance and legal functions, corporate strategy, that benefit the group as a whole. Whether and how much of those central costs can be charged out to operating subsidiaries is one of the oldest disputes in transfer pricing, and the OECD's stewardship activity carve-out remains the central line every head office cost allocation needs to be tested against.
The Stewardship Activity Exclusion
Chapter VII of the OECD Guidelines excludes from chargeable services what it terms shareholder or stewardship activities, functions a parent performs purely in its capacity as an investor or shareholder, such as costs of the parent's own legal structure, shareholder meetings, listing requirements, or the parent's own corporate governance obligations, which independent enterprises would not pay a fee to receive because they provide no identifiable benefit to the subsidiary beyond what shareholding itself confers. A cost incurred purely because the parent is a public company, for instance, is not converted into a chargeable service simply by being allocated to a subsidiary's cost base.
Distinguishing Stewardship from Genuine Management Services
The line becomes genuinely difficult where a head office function sits between pure stewardship and a genuine service, group-wide treasury oversight, centralised IT infrastructure, or strategic planning support that a subsidiary would plausibly have paid an independent provider to obtain if the group did not supply it internally. The test the OECD applies is whether an independent enterprise, in comparable circumstances, would have been willing to pay for the activity or perform it in-house itself, rather than whether the activity happens to benefit the subsidiary incidentally as a by-product of the parent's own governance.
The Benefit Test and Incidental Benefit
A subsidiary receiving only an incidental benefit from an activity performed for the parent's own purposes, learning of a group-wide policy decision made for the parent's own governance reasons, for instance, does not thereby become liable to pay for that activity as a service, since the benefit test requires an identifiable and direct benefit to the recipient distinct from the general advantages of group membership. This distinction is frequently contested in practice, since head office cost pools rarely separate stewardship and genuine service elements cleanly at the point costs are first incurred.
Duplicative Services and the On-Call Service Question
Two further exclusions commonly arise alongside stewardship. Duplicative services, where a subsidiary already performs the same function itself and the head office merely reviews or oversees it without adding a distinct benefit, generally should not be separately charged, except where the duplication itself serves a legitimate business purpose such as risk mitigation. On-call or standby services, where a head office maintains availability to provide support a subsidiary might need but does not always use, can be chargeable, but only where the availability itself has genuine value, comparable to an independent enterprise paying an insurance-like retainer for guaranteed access to a resource.
Allocation Keys and Cost Pool Hygiene
Once genuinely chargeable head office costs are isolated from stewardship and duplicative elements, they need to be allocated across recipient subsidiaries using a key that genuinely correlates with each subsidiary's consumption of the service, revenue, headcount, or a more specific usage-based metric depending on the service type, rather than a single blanket key applied indiscriculately across a bundled bundle of functionally different services. A cost pool that mixes stewardship, duplicative, and genuinely chargeable elements without segregation is one of the most common weaknesses tax authorities identify in head office charge reviews.
Conclusion
The stewardship exclusion under Chapter VII is a narrower carve-out than groups often assume, and the practical discipline it requires is segregating a head office cost pool at source into stewardship, duplicative, and genuinely chargeable elements, rather than applying a single blended markup to an undifferentiated central cost base. Groups that maintain this segregation contemporaneously are far better positioned than those attempting to reconstruct it once a subsidiary's tax authority challenges the charge.
Every multinational group incurs central costs, executive management, group-wide finance and legal functions, corporate strategy, that benefit the group as a whole. Whether and how much of those central costs can be charged out to operating subsidiaries is one of the oldest disputes in transfer pricing, and the OECD's stewardship activity carve-out remains the central line every head office cost allocation needs to be tested against.
The Stewardship Activity Exclusion
Chapter VII of the OECD Guidelines excludes from chargeable services what it terms shareholder or stewardship activities, functions a parent performs purely in its capacity as an investor or shareholder, such as costs of the parent's own legal structure, shareholder meetings, listing requirements, or the parent's own corporate governance obligations, which independent enterprises would not pay a fee to receive because they provide no identifiable benefit to the subsidiary beyond what shareholding itself confers. A cost incurred purely because the parent is a public company, for instance, is not converted into a chargeable service simply by being allocated to a subsidiary's cost base.
Distinguishing Stewardship from Genuine Management Services
The line becomes genuinely difficult where a head office function sits between pure stewardship and a genuine service, group-wide treasury oversight, centralised IT infrastructure, or strategic planning support that a subsidiary would plausibly have paid an independent provider to obtain if the group did not supply it internally. The test the OECD applies is whether an independent enterprise, in comparable circumstances, would have been willing to pay for the activity or perform it in-house itself, rather than whether the activity happens to benefit the subsidiary incidentally as a by-product of the parent's own governance.
The Benefit Test and Incidental Benefit
A subsidiary receiving only an incidental benefit from an activity performed for the parent's own purposes, learning of a group-wide policy decision made for the parent's own governance reasons, for instance, does not thereby become liable to pay for that activity as a service, since the benefit test requires an identifiable and direct benefit to the recipient distinct from the general advantages of group membership. This distinction is frequently contested in practice, since head office cost pools rarely separate stewardship and genuine service elements cleanly at the point costs are first incurred.
Duplicative Services and the On-Call Service Question
Two further exclusions commonly arise alongside stewardship. Duplicative services, where a subsidiary already performs the same function itself and the head office merely reviews or oversees it without adding a distinct benefit, generally should not be separately charged, except where the duplication itself serves a legitimate business purpose such as risk mitigation. On-call or standby services, where a head office maintains availability to provide support a subsidiary might need but does not always use, can be chargeable, but only where the availability itself has genuine value, comparable to an independent enterprise paying an insurance-like retainer for guaranteed access to a resource.
Allocation Keys and Cost Pool Hygiene
Once genuinely chargeable head office costs are isolated from stewardship and duplicative elements, they need to be allocated across recipient subsidiaries using a key that genuinely correlates with each subsidiary's consumption of the service, revenue, headcount, or a more specific usage-based metric depending on the service type, rather than a single blanket key applied indiscriculately across a bundled bundle of functionally different services. A cost pool that mixes stewardship, duplicative, and genuinely chargeable elements without segregation is one of the most common weaknesses tax authorities identify in head office charge reviews.
Conclusion
The stewardship exclusion under Chapter VII is a narrower carve-out than groups often assume, and the practical discipline it requires is segregating a head office cost pool at source into stewardship, duplicative, and genuinely chargeable elements, rather than applying a single blended markup to an undifferentiated central cost base. Groups that maintain this segregation contemporaneously are far better positioned than those attempting to reconstruct it once a subsidiary's tax authority challenges the charge.
Read More

Valuing Intangibles: Relief-from-Royalty, MEEM, and the Income Approach in Practice
Valuing Intangibles: Relief-from-Royalty, MEEM, and the Income Approach in Practice
Once a transfer pricing analysis establishes that an intangible needs to be priced, whether for a licence, a CCA buy-in, or a business restructuring exit charge, a genuine valuation is required, and the choice of valuation methodology often matters as much to the resulting figure as the underlying financial projections themselves. Three methodologies dominate practice, and each answers a subtly different question.
The Relief-from-Royalty Method
Relief-from-royalty values an intangible, typically a trademark or brand, by estimating the royalty rate the owner would otherwise have had to pay a third party to license an equivalent asset, applying that rate to the projected revenue the intangible will generate, and discounting the resulting royalty stream to present value. The method's core strength is its direct link to observable market royalty rates for comparable intangibles, and its core weakness is the same as any CUP-based approach, finding a genuinely comparable licensing arrangement, in terms of exclusivity, territory, and intangible quality, is often difficult.
The Multi-Period Excess Earnings Method (MEEM)
MEEM values an intangible by isolating the portion of a business's total earnings attributable specifically to that intangible, after deducting contributory asset charges representing a fair return on all the other tangible and intangible assets that also contribute to generating those earnings, such as working capital, fixed assets, and an assembled workforce. MEEM is generally reserved for the single most significant intangible driving a business's earnings, since applying it to more than one intangible within the same business risks double-counting the same underlying earnings stream across multiple valuations.
The Broader Income Approach and Discount Rate Selection
Both relief-from-royalty and MEEM sit within the broader income approach family, which values an asset based on the present value of the future economic benefits it is expected to generate. The discount rate selected, typically built up from a weighted average cost of capital adjusted for the specific risk profile of the intangible and the cash flows attributable to it, is frequently the single most contested input in an intangible valuation, since a modest change in discount rate can produce a materially different valuation output even where the underlying revenue projections are uncontested.
Cost and Market Approaches as Cross-Checks
Where reliable data exists, a cost approach, valuing the intangible based on the cost to recreate or replace it, or a market approach, based on observable transactions involving comparable intangibles, can serve as a useful cross-check against the primary income-approach valuation, even where the income approach remains the primary method for genuinely unique, revenue-generating intangibles. A valuation that relies on income approach alone, with no cross-check against any independent methodology, is more vulnerable to challenge than one presenting a reconciled range across more than one approach.
Documenting the Valuation for Transfer Pricing Purposes
A transfer pricing-ready valuation file needs to document not just the final figure but the full chain of assumptions behind it, revenue and cost projections and their source, the royalty rate or contributory asset charges selected and the comparables or benchmarks supporting them, and the discount rate build-up with each component justified. Valuations prepared purely for financial reporting or M&A purposes frequently omit this level of assumption-level detail, which means they often need to be substantially supplemented, not simply repurposed, before they can support a transfer pricing position.
Conclusion
Relief-from-royalty, MEEM, and the broader income approach each answer a genuinely different valuation question, and selecting the wrong one for the specific intangible and transaction type is a more common source of valuation weakness than any single flawed input assumption. A transfer pricing valuation should identify explicitly why the chosen method fits the intangible being valued, and where practical, present at least one cross-check methodology alongside it.
Once a transfer pricing analysis establishes that an intangible needs to be priced, whether for a licence, a CCA buy-in, or a business restructuring exit charge, a genuine valuation is required, and the choice of valuation methodology often matters as much to the resulting figure as the underlying financial projections themselves. Three methodologies dominate practice, and each answers a subtly different question.
The Relief-from-Royalty Method
Relief-from-royalty values an intangible, typically a trademark or brand, by estimating the royalty rate the owner would otherwise have had to pay a third party to license an equivalent asset, applying that rate to the projected revenue the intangible will generate, and discounting the resulting royalty stream to present value. The method's core strength is its direct link to observable market royalty rates for comparable intangibles, and its core weakness is the same as any CUP-based approach, finding a genuinely comparable licensing arrangement, in terms of exclusivity, territory, and intangible quality, is often difficult.
The Multi-Period Excess Earnings Method (MEEM)
MEEM values an intangible by isolating the portion of a business's total earnings attributable specifically to that intangible, after deducting contributory asset charges representing a fair return on all the other tangible and intangible assets that also contribute to generating those earnings, such as working capital, fixed assets, and an assembled workforce. MEEM is generally reserved for the single most significant intangible driving a business's earnings, since applying it to more than one intangible within the same business risks double-counting the same underlying earnings stream across multiple valuations.
The Broader Income Approach and Discount Rate Selection
Both relief-from-royalty and MEEM sit within the broader income approach family, which values an asset based on the present value of the future economic benefits it is expected to generate. The discount rate selected, typically built up from a weighted average cost of capital adjusted for the specific risk profile of the intangible and the cash flows attributable to it, is frequently the single most contested input in an intangible valuation, since a modest change in discount rate can produce a materially different valuation output even where the underlying revenue projections are uncontested.
Cost and Market Approaches as Cross-Checks
Where reliable data exists, a cost approach, valuing the intangible based on the cost to recreate or replace it, or a market approach, based on observable transactions involving comparable intangibles, can serve as a useful cross-check against the primary income-approach valuation, even where the income approach remains the primary method for genuinely unique, revenue-generating intangibles. A valuation that relies on income approach alone, with no cross-check against any independent methodology, is more vulnerable to challenge than one presenting a reconciled range across more than one approach.
Documenting the Valuation for Transfer Pricing Purposes
A transfer pricing-ready valuation file needs to document not just the final figure but the full chain of assumptions behind it, revenue and cost projections and their source, the royalty rate or contributory asset charges selected and the comparables or benchmarks supporting them, and the discount rate build-up with each component justified. Valuations prepared purely for financial reporting or M&A purposes frequently omit this level of assumption-level detail, which means they often need to be substantially supplemented, not simply repurposed, before they can support a transfer pricing position.
Conclusion
Relief-from-royalty, MEEM, and the broader income approach each answer a genuinely different valuation question, and selecting the wrong one for the specific intangible and transaction type is a more common source of valuation weakness than any single flawed input assumption. A transfer pricing valuation should identify explicitly why the chosen method fits the intangible being valued, and where practical, present at least one cross-check methodology alongside it.
Read More

Safe Harbour Rules for India's IT, ITES and KPO Sectors: Trading Certainty for Margin
Safe Harbour Rules for India's IT, ITES and KPO Sectors: Trading Certainty for Margin
India's safe harbour rules, notified under Rule 10TA to 10TG of the Income-tax Rules, offer eligible taxpayers in specified sectors, most prominently software development, IT-enabled services, and knowledge process outsourcing, a pre-agreed operating margin that the tax authority will accept without a detailed benchmarking challenge, in exchange for the taxpayer giving up the flexibility to argue for a lower margin through conventional TP analysis.
The Core Trade-Off
Electing into the safe harbour regime means the taxpayer commits to a specified minimum operating margin on the relevant category of international transaction, set by reference to operating expenses, and in return the tax authority agrees not to scrutinise or adjust that margin through a conventional transfer pricing audit. This is a genuine trade-off, not a pure benefit: taxpayers whose actual defensible arm's length margin, properly benchmarked, would be lower than the safe harbour rate are effectively paying more Indian tax than a conventional TP position would require, in exchange for audit certainty.
Categories and Indicative Rates
The regime sets differentiated rates by transaction category and value band, with software development and IT-enabled services generally requiring a lower margin band at higher transaction values and a higher band at lower values, knowledge process outsourcing services requiring a distinctly higher margin reflecting the sector's typically higher value-add, and contract R&D in the software and pharmaceutical sectors carrying their own separate specified rates. Because rates are periodically revised and vary by exact transaction value threshold, groups should confirm the currently notified rate for their specific category and value band rather than relying on a rate applicable in an earlier notification cycle.
Eligibility Conditions Beyond the Rate
Beyond meeting the margin threshold, eligibility requires the taxpayer to file the safe harbour option in the prescribed form within the statutory timeline, and the covered international transactions must fall within the specific defined categories the rules list, meaning a taxpayer performing a mix of qualifying and non-qualifying services needs to segregate its transactions carefully, since the safe harbour only covers the transactions that genuinely fall within a notified category and cannot be applied to the taxpayer's international transactions as a blanket election.
The Five Year Validity and Withdrawal Risk
An exercised safe harbour option, once validly made, remains in force for the specified number of assessment years, generally up to five, without needing to be re-elected annually, but the option can be held invalid if the tax authority determines the taxpayer did not genuinely meet the eligibility conditions for the category claimed, which exposes the taxpayer to the underlying transactions being subjected to a full conventional transfer pricing audit retrospectively, precisely the outcome the safe harbour was meant to avoid.
Weighing Safe Harbour Against a Conventional APA
For groups with a stable, high-confidence functional profile that would independently justify a margin at or below the safe harbour rate, an Advance Pricing Agreement generally remains the more economically efficient route to certainty, since it can lock in the taxpayer's actual defensible margin rather than the safe harbour's often more conservative rate. Safe harbour tends to make the most sense for smaller captive centres where the incremental cost of the higher guaranteed margin is outweighed by the compliance and litigation cost the taxpayer avoids by not running a full APA negotiation.
Conclusion
The safe harbour regime under Rules 10TA to 10TG is a genuine certainty-for-margin trade, and the right election depends entirely on how the safe harbour rate compares to what the taxpayer's own functional and benchmarking analysis would independently support. Groups should run that comparison explicitly before electing in, rather than treating safe harbour as a default simplification for every eligible captive centre.
India's safe harbour rules, notified under Rule 10TA to 10TG of the Income-tax Rules, offer eligible taxpayers in specified sectors, most prominently software development, IT-enabled services, and knowledge process outsourcing, a pre-agreed operating margin that the tax authority will accept without a detailed benchmarking challenge, in exchange for the taxpayer giving up the flexibility to argue for a lower margin through conventional TP analysis.
The Core Trade-Off
Electing into the safe harbour regime means the taxpayer commits to a specified minimum operating margin on the relevant category of international transaction, set by reference to operating expenses, and in return the tax authority agrees not to scrutinise or adjust that margin through a conventional transfer pricing audit. This is a genuine trade-off, not a pure benefit: taxpayers whose actual defensible arm's length margin, properly benchmarked, would be lower than the safe harbour rate are effectively paying more Indian tax than a conventional TP position would require, in exchange for audit certainty.
Categories and Indicative Rates
The regime sets differentiated rates by transaction category and value band, with software development and IT-enabled services generally requiring a lower margin band at higher transaction values and a higher band at lower values, knowledge process outsourcing services requiring a distinctly higher margin reflecting the sector's typically higher value-add, and contract R&D in the software and pharmaceutical sectors carrying their own separate specified rates. Because rates are periodically revised and vary by exact transaction value threshold, groups should confirm the currently notified rate for their specific category and value band rather than relying on a rate applicable in an earlier notification cycle.
Eligibility Conditions Beyond the Rate
Beyond meeting the margin threshold, eligibility requires the taxpayer to file the safe harbour option in the prescribed form within the statutory timeline, and the covered international transactions must fall within the specific defined categories the rules list, meaning a taxpayer performing a mix of qualifying and non-qualifying services needs to segregate its transactions carefully, since the safe harbour only covers the transactions that genuinely fall within a notified category and cannot be applied to the taxpayer's international transactions as a blanket election.
The Five Year Validity and Withdrawal Risk
An exercised safe harbour option, once validly made, remains in force for the specified number of assessment years, generally up to five, without needing to be re-elected annually, but the option can be held invalid if the tax authority determines the taxpayer did not genuinely meet the eligibility conditions for the category claimed, which exposes the taxpayer to the underlying transactions being subjected to a full conventional transfer pricing audit retrospectively, precisely the outcome the safe harbour was meant to avoid.
Weighing Safe Harbour Against a Conventional APA
For groups with a stable, high-confidence functional profile that would independently justify a margin at or below the safe harbour rate, an Advance Pricing Agreement generally remains the more economically efficient route to certainty, since it can lock in the taxpayer's actual defensible margin rather than the safe harbour's often more conservative rate. Safe harbour tends to make the most sense for smaller captive centres where the incremental cost of the higher guaranteed margin is outweighed by the compliance and litigation cost the taxpayer avoids by not running a full APA negotiation.
Conclusion
The safe harbour regime under Rules 10TA to 10TG is a genuine certainty-for-margin trade, and the right election depends entirely on how the safe harbour rate compares to what the taxpayer's own functional and benchmarking analysis would independently support. Groups should run that comparison explicitly before electing in, rather than treating safe harbour as a default simplification for every eligible captive centre.
Read More

The Range Concept and Multiple Year Data: Reading Rule 10CA and Rule 10B Correctly
The Range Concept and Multiple Year Data: Reading Rule 10CA and Rule 10B Correctly
India's transition from a strict arithmetic mean standard to a statistical range concept, introduced through Rule 10CA, changed how a benchmarking study's comparable set translates into an accepted arm's length price. Combined with Rule 10B's provisions on the use of multiple year data, the two rules together determine not just which comparables qualify, but which specific figure within an accepted set a taxpayer can actually rely on.
When the Range Concept Applies
The range concept under Rule 10CA is only available where the comparable set contains six or more entries after the most appropriate method has been applied, and where the method used is one of the price or margin-based methods, CUP, resale price, cost plus, TNMM, or PSM's specified variant, that Rule 10CA lists as eligible. Where the comparable set contains fewer than six entries, the older arithmetic mean plus a permitted variation band continues to apply instead, which makes the size of the final comparable set a threshold determination with real consequences for which computational rule governs the outcome.
Where the Taxpayer Can Land Within the Range
Once the thirty-fifth to sixty-fifth percentile range is established from the qualifying comparable set, a taxpayer's actual transfer price is accepted without adjustment if it falls anywhere within that range, and where it does not, the adjustment is computed by reference to the median of the range rather than the nearest edge, a materially more conservative outcome than simply nudging the price to the closer boundary. This median-based adjustment mechanic is frequently overlooked in preliminary risk modelling, which tends to assume a boundary-based true-up.
The Multiple Year Data Requirement Under Rule 10B
Rule 10B permits, and in the range-concept context effectively requires, the use of data for the tested party's current year together with data for the two preceding years for the comparables used, rather than testing against single-year comparable data alone. The rationale is that a single year's results can be distorted by short-term cyclical or one-off factors, and averaging or otherwise incorporating multiple years smooths out that noise to produce a more reliable range, but it also means the benchmarking study needs multi-year financial data availability for every comparable retained, which is not always straightforward for smaller or less transparent comparable companies.
Current Year Data and the Contemporaneous Documentation Tension
A persistent practical friction is that current-year comparable data is frequently unavailable at the time the taxpayer must prepare contemporaneous documentation, since comparable companies' financial statements for the same year are often not yet filed or publicly available when the taxpayer's own transfer pricing study is due. Rule 10B addresses this by permitting the use of data available up to the date of filing where current year data is genuinely not available at the time of preparing documentation, provided the taxpayer updates the analysis before the return is filed if better data becomes available.
Combining the Two Rules in Practice
In a properly constructed Indian benchmarking study, the search first identifies a qualifying comparable set of at least six entities, then pulls current and two preceding years' data for each, computes the resulting range using the weighted or averaged approach the rules prescribe, and finally tests the tested party's actual margin against that computed range, applying a median-based adjustment only where the price genuinely falls outside it. Skipping the multi-year data step, or applying the range concept to a five-comparable set that does not meet the six-entry threshold, are the two most common technical errors that unravel an otherwise sound study on review.
Conclusion
Rule 10CA's range concept and Rule 10B's multiple year data requirement operate as a single integrated computational mechanism, not two independent rules, and both the threshold entry conditions and the median-based adjustment mechanic materially change the practical outcome of a benchmarking study compared to the older single-year arithmetic mean standard. Groups preparing Indian TP documentation should confirm both threshold conditions are met before assuming the more favourable range-based outcome applies.
India's transition from a strict arithmetic mean standard to a statistical range concept, introduced through Rule 10CA, changed how a benchmarking study's comparable set translates into an accepted arm's length price. Combined with Rule 10B's provisions on the use of multiple year data, the two rules together determine not just which comparables qualify, but which specific figure within an accepted set a taxpayer can actually rely on.
When the Range Concept Applies
The range concept under Rule 10CA is only available where the comparable set contains six or more entries after the most appropriate method has been applied, and where the method used is one of the price or margin-based methods, CUP, resale price, cost plus, TNMM, or PSM's specified variant, that Rule 10CA lists as eligible. Where the comparable set contains fewer than six entries, the older arithmetic mean plus a permitted variation band continues to apply instead, which makes the size of the final comparable set a threshold determination with real consequences for which computational rule governs the outcome.
Where the Taxpayer Can Land Within the Range
Once the thirty-fifth to sixty-fifth percentile range is established from the qualifying comparable set, a taxpayer's actual transfer price is accepted without adjustment if it falls anywhere within that range, and where it does not, the adjustment is computed by reference to the median of the range rather than the nearest edge, a materially more conservative outcome than simply nudging the price to the closer boundary. This median-based adjustment mechanic is frequently overlooked in preliminary risk modelling, which tends to assume a boundary-based true-up.
The Multiple Year Data Requirement Under Rule 10B
Rule 10B permits, and in the range-concept context effectively requires, the use of data for the tested party's current year together with data for the two preceding years for the comparables used, rather than testing against single-year comparable data alone. The rationale is that a single year's results can be distorted by short-term cyclical or one-off factors, and averaging or otherwise incorporating multiple years smooths out that noise to produce a more reliable range, but it also means the benchmarking study needs multi-year financial data availability for every comparable retained, which is not always straightforward for smaller or less transparent comparable companies.
Current Year Data and the Contemporaneous Documentation Tension
A persistent practical friction is that current-year comparable data is frequently unavailable at the time the taxpayer must prepare contemporaneous documentation, since comparable companies' financial statements for the same year are often not yet filed or publicly available when the taxpayer's own transfer pricing study is due. Rule 10B addresses this by permitting the use of data available up to the date of filing where current year data is genuinely not available at the time of preparing documentation, provided the taxpayer updates the analysis before the return is filed if better data becomes available.
Combining the Two Rules in Practice
In a properly constructed Indian benchmarking study, the search first identifies a qualifying comparable set of at least six entities, then pulls current and two preceding years' data for each, computes the resulting range using the weighted or averaged approach the rules prescribe, and finally tests the tested party's actual margin against that computed range, applying a median-based adjustment only where the price genuinely falls outside it. Skipping the multi-year data step, or applying the range concept to a five-comparable set that does not meet the six-entry threshold, are the two most common technical errors that unravel an otherwise sound study on review.
Conclusion
Rule 10CA's range concept and Rule 10B's multiple year data requirement operate as a single integrated computational mechanism, not two independent rules, and both the threshold entry conditions and the median-based adjustment mechanic materially change the practical outcome of a benchmarking study compared to the older single-year arithmetic mean standard. Groups preparing Indian TP documentation should confirm both threshold conditions are met before assuming the more favourable range-based outcome applies.
Read More

Amount B: The OECD's Attempt to Standardise Baseline Distribution Pricing
Amount B: The OECD's Attempt to Standardise Baseline Distribution Pricing
Amount B, finalised under the OECD/G20 Inclusive Framework, targets one of the most disputed and highest-volume categories of intercompany transaction: baseline marketing and distribution activity. Rather than requiring a fresh benchmarking study for every routine distributor in every jurisdiction, Amount B offers a simplified, formula-driven return intended to reduce both compliance cost and the sheer volume of low-value distributor disputes that consume disproportionate tax authority and taxpayer resources.
Which Transactions Amount B Covers
Amount B applies to baseline wholesale distribution, sales agency, and commissionaire arrangements where the entity does not carry economically significant intangibles, does not assume more than a defined level of inventory or credit risk, and does not perform any activities beyond marketing and distribution of tangible goods. Distributors performing additional functions, such as meaningful manufacturing, significant R&D, or holding valuable local intangibles, fall outside its scope and continue to require a conventional functional and benchmarking analysis.
The Pricing Matrix Mechanism
Rather than a single fixed markup, Amount B applies a pricing matrix that adjusts the expected operating margin based on the tested party's industry grouping and a set of financial ratios, principally operating asset intensity and operating expense intensity, that serve as objective proxies for the distributor's actual functional profile within the qualifying baseline category. This is intended to preserve some differentiation between distributors of genuinely different intensity while avoiding a full bespoke benchmarking exercise for each one.
Adoption Is Elective, Not Universal
Critically, Amount B is not mandatory under the OECD framework itself; individual jurisdictions choose whether to adopt it, and where they do, whether to apply it only for inbound transactions, only for outbound, or both. A group operating a distributor in a jurisdiction that has not adopted Amount B cannot rely on the simplified matrix there regardless of how the counterparty jurisdiction treats the same transaction, which means the practical benefit of Amount B currently depends heavily on which specific country pairs are involved.
Interaction with Existing Local Rules and APAs
Where a jurisdiction already operates its own safe harbour regime, or where a distributor's pricing is already covered by an existing bilateral or unilateral APA, groups need to work through how Amount B interacts with, rather than simply replaces, those existing arrangements. In several early-adopting jurisdictions, taxpayers retain an election to apply either Amount B or their existing benchmarking approach, which means the analysis is not purely mechanical, groups should model both outcomes before defaulting into the simplified approach purely for compliance convenience.
Practical Steps Before Relying on Amount B
Before adopting Amount B for any given distributor, a group should confirm bilateral adoption by both the distributor's jurisdiction and the counterparty's, verify the distributor genuinely falls within the qualifying baseline scope rather than performing functions that would exclude it, and run a comparison against the group's existing benchmarking outcome to confirm the matrix result does not produce a materially different, and potentially less defensible, margin than the conventional analysis would support.
Conclusion
Amount B offers a genuine simplification opportunity for qualifying baseline distributors, but only where both relevant jurisdictions have adopted it and the distributor's actual functional profile falls cleanly within its intended scope. Groups should treat the pricing matrix as one input to compare against a conventional benchmarking outcome, rather than an automatic default, until adoption becomes more consistent across the group's key trading jurisdictions.
Amount B, finalised under the OECD/G20 Inclusive Framework, targets one of the most disputed and highest-volume categories of intercompany transaction: baseline marketing and distribution activity. Rather than requiring a fresh benchmarking study for every routine distributor in every jurisdiction, Amount B offers a simplified, formula-driven return intended to reduce both compliance cost and the sheer volume of low-value distributor disputes that consume disproportionate tax authority and taxpayer resources.
Which Transactions Amount B Covers
Amount B applies to baseline wholesale distribution, sales agency, and commissionaire arrangements where the entity does not carry economically significant intangibles, does not assume more than a defined level of inventory or credit risk, and does not perform any activities beyond marketing and distribution of tangible goods. Distributors performing additional functions, such as meaningful manufacturing, significant R&D, or holding valuable local intangibles, fall outside its scope and continue to require a conventional functional and benchmarking analysis.
The Pricing Matrix Mechanism
Rather than a single fixed markup, Amount B applies a pricing matrix that adjusts the expected operating margin based on the tested party's industry grouping and a set of financial ratios, principally operating asset intensity and operating expense intensity, that serve as objective proxies for the distributor's actual functional profile within the qualifying baseline category. This is intended to preserve some differentiation between distributors of genuinely different intensity while avoiding a full bespoke benchmarking exercise for each one.
Adoption Is Elective, Not Universal
Critically, Amount B is not mandatory under the OECD framework itself; individual jurisdictions choose whether to adopt it, and where they do, whether to apply it only for inbound transactions, only for outbound, or both. A group operating a distributor in a jurisdiction that has not adopted Amount B cannot rely on the simplified matrix there regardless of how the counterparty jurisdiction treats the same transaction, which means the practical benefit of Amount B currently depends heavily on which specific country pairs are involved.
Interaction with Existing Local Rules and APAs
Where a jurisdiction already operates its own safe harbour regime, or where a distributor's pricing is already covered by an existing bilateral or unilateral APA, groups need to work through how Amount B interacts with, rather than simply replaces, those existing arrangements. In several early-adopting jurisdictions, taxpayers retain an election to apply either Amount B or their existing benchmarking approach, which means the analysis is not purely mechanical, groups should model both outcomes before defaulting into the simplified approach purely for compliance convenience.
Practical Steps Before Relying on Amount B
Before adopting Amount B for any given distributor, a group should confirm bilateral adoption by both the distributor's jurisdiction and the counterparty's, verify the distributor genuinely falls within the qualifying baseline scope rather than performing functions that would exclude it, and run a comparison against the group's existing benchmarking outcome to confirm the matrix result does not produce a materially different, and potentially less defensible, margin than the conventional analysis would support.
Conclusion
Amount B offers a genuine simplification opportunity for qualifying baseline distributors, but only where both relevant jurisdictions have adopted it and the distributor's actual functional profile falls cleanly within its intended scope. Groups should treat the pricing matrix as one input to compare against a conventional benchmarking outcome, rather than an automatic default, until adoption becomes more consistent across the group's key trading jurisdictions.
Read More

Master File, Local File and CbCR: Making the Three-Tiered Documentation Standard Work Together
Master File, Local File and CbCR: Making the Three-Tiered Documentation Standard Work Together
BEPS Action 13 replaced a patchwork of jurisdiction-specific transfer pricing documentation rules with a coordinated three-tiered standard: the Master File, the Local File, and the Country-by-Country Report. Each serves a different audience and a different purpose, and the most common compliance failure is not missing any one of the three, but preparing them without reconciling the numbers and narrative across all three.
The Master File: The Group-Wide Blueprint
The Master File provides a high-level overview of the MNE group's global business, including its organisational structure, description of its business drivers, intangibles strategy, intercompany financing arrangements, and consolidated financial and tax positions. It is filed identically, or near-identically, in every jurisdiction the group operates in, which means any inconsistency between the group narrative it presents and the specific transactions described in a given country's Local File is immediately visible to that country's tax authority on a side-by-side read.
The Local File: Country-Specific Transaction Detail
The Local File supplements the Master File with information specific to the material controlled transactions of the local entity, including a detailed functional analysis, the transfer pricing method selected for each material transaction category, and the benchmarking analysis supporting it. Because the Local File is prepared separately in each jurisdiction, often by different local teams or advisors, functional descriptions can drift from the group-wide characterisation set out in the Master File if the two are not prepared and reviewed together.
Country-by-Country Reporting: The Risk-Assessment Trigger
CbCR, generally required for groups with consolidated revenue above the applicable threshold, most commonly seven hundred and fifty million euros, reports revenue, profit before tax, tax paid and accrued, headcount, and tangible assets on a per-jurisdiction basis. CbCR is explicitly designed as a high-level risk-assessment tool rather than a pricing justification in itself, but a jurisdiction showing disproportionately high profit relative to headcount and tangible assets is a well-established audit trigger, and tax authorities increasingly cross-reference CbCR figures against the narrative in the Master and Local Files for the same jurisdiction.
Where the Three Tiers Contradict Each Other
The most damaging documentation failure is internal inconsistency: a Master File describing centralised strategic decision-making at the parent, a Local File describing the same local entity as bearing meaningful entrepreneurial risk, and a CbCR showing that jurisdiction earning outsized profit relative to its reported headcount. Any reviewing tax authority reading all three together will identify the contradiction immediately, and a documentation package that fails on internal consistency undermines the credibility of even a technically sound benchmarking analysis contained within it.
Building a Coordinated Preparation Process
Groups that treat the three tiers as three separate compliance deliverables, prepared by different teams on different timelines, are structurally more exposed than groups that run a single coordinated process: draft the Master File narrative first, cascade the same functional characterisations into every Local File, and reconcile the CbCR figures against both before any of the three is finalised and filed. Building this sequencing into the annual compliance calendar, rather than treating each filing as an independent year-end task, is the single most effective structural fix available to a group with material cross-border operations.
Conclusion
The three-tiered documentation standard under Action 13 was designed to be read together, and tax authorities now do exactly that as a first step in risk assessment, well before opening a detailed transaction-level audit. A Master File, Local File, and CbCR that tell three subtly different stories about the same group is a more common and more damaging failure than any single weak benchmarking study, and it is entirely avoidable through coordinated preparation.
BEPS Action 13 replaced a patchwork of jurisdiction-specific transfer pricing documentation rules with a coordinated three-tiered standard: the Master File, the Local File, and the Country-by-Country Report. Each serves a different audience and a different purpose, and the most common compliance failure is not missing any one of the three, but preparing them without reconciling the numbers and narrative across all three.
The Master File: The Group-Wide Blueprint
The Master File provides a high-level overview of the MNE group's global business, including its organisational structure, description of its business drivers, intangibles strategy, intercompany financing arrangements, and consolidated financial and tax positions. It is filed identically, or near-identically, in every jurisdiction the group operates in, which means any inconsistency between the group narrative it presents and the specific transactions described in a given country's Local File is immediately visible to that country's tax authority on a side-by-side read.
The Local File: Country-Specific Transaction Detail
The Local File supplements the Master File with information specific to the material controlled transactions of the local entity, including a detailed functional analysis, the transfer pricing method selected for each material transaction category, and the benchmarking analysis supporting it. Because the Local File is prepared separately in each jurisdiction, often by different local teams or advisors, functional descriptions can drift from the group-wide characterisation set out in the Master File if the two are not prepared and reviewed together.
Country-by-Country Reporting: The Risk-Assessment Trigger
CbCR, generally required for groups with consolidated revenue above the applicable threshold, most commonly seven hundred and fifty million euros, reports revenue, profit before tax, tax paid and accrued, headcount, and tangible assets on a per-jurisdiction basis. CbCR is explicitly designed as a high-level risk-assessment tool rather than a pricing justification in itself, but a jurisdiction showing disproportionately high profit relative to headcount and tangible assets is a well-established audit trigger, and tax authorities increasingly cross-reference CbCR figures against the narrative in the Master and Local Files for the same jurisdiction.
Where the Three Tiers Contradict Each Other
The most damaging documentation failure is internal inconsistency: a Master File describing centralised strategic decision-making at the parent, a Local File describing the same local entity as bearing meaningful entrepreneurial risk, and a CbCR showing that jurisdiction earning outsized profit relative to its reported headcount. Any reviewing tax authority reading all three together will identify the contradiction immediately, and a documentation package that fails on internal consistency undermines the credibility of even a technically sound benchmarking analysis contained within it.
Building a Coordinated Preparation Process
Groups that treat the three tiers as three separate compliance deliverables, prepared by different teams on different timelines, are structurally more exposed than groups that run a single coordinated process: draft the Master File narrative first, cascade the same functional characterisations into every Local File, and reconcile the CbCR figures against both before any of the three is finalised and filed. Building this sequencing into the annual compliance calendar, rather than treating each filing as an independent year-end task, is the single most effective structural fix available to a group with material cross-border operations.
Conclusion
The three-tiered documentation standard under Action 13 was designed to be read together, and tax authorities now do exactly that as a first step in risk assessment, well before opening a detailed transaction-level audit. A Master File, Local File, and CbCR that tell three subtly different stories about the same group is a more common and more damaging failure than any single weak benchmarking study, and it is entirely avoidable through coordinated preparation.
Read More

The Authorised OECD Approach: Attributing Profits to a Permanent Establishment
The Authorised OECD Approach: Attributing Profits to a Permanent Establishment
Once a foreign enterprise is found to have a permanent establishment (PE) in a jurisdiction, whether through a fixed place of business, a dependent agent, or increasingly a digital or service PE, a second and separate question arises: how much of the enterprise's profit should that PE be taxed on. The Authorised OECD Approach (AOA) answers this by treating the PE, functionally, as if it were a distinct and separate enterprise dealing with the rest of the head office on arm's length terms.
The Functionally Separate Entity Fiction
The AOA's central move is to apply the same functional, asset, and risk analysis used in conventional transfer pricing to the internal relationship between the PE and the rest of the enterprise, hypothesising a set of dealings between them as if they were separate legal entities. This is a genuine conceptual departure from the older, more mechanical formulary approaches some treaties and domestic laws still use, and it means a PE attribution exercise now largely mirrors a standard TP functional analysis, applied internally rather than across group entities.
Step One: The Functional and Factual Analysis
The first stage attributes to the PE the significant people functions actually performed there, meaning the people whose decisions genuinely create or manage risk and use assets, not merely administrative or support staff physically located at the PE. Where key decision-makers, such as traders taking on market risk or senior personnel negotiating material contracts, are located at the PE, the risks and assets associated with those decisions are attributed there even if formal legal documentation assigns them to the head office.
Step Two: Pricing the Internal Dealings
Once functions, assets, and risks are attributed, the second stage prices the notional dealings between the PE and the rest of the enterprise using conventional transfer pricing methods, CUP, cost-plus, TNMM, or profit split, exactly as would be applied to a genuine intercompany transaction. A PE that performs limited distribution functions on behalf of the head office would, under this fiction, be attributed a routine distributor-type return, while a PE housing the enterprise's key trading or decision-making function would be attributed a much larger share of overall profit.
Capital Attribution and Free Capital
Because a PE has no separate legal capital structure of its own, the AOA requires a notional allocation of 'free capital', capital not associated with a specific liability, sufficient to support the assets and risks attributed to it, using methods such as the capital allocation approach or a thin-capitalisation approach benchmarked against comparable independent enterprises in the same industry. Under-capitalising a PE relative to the risk profile attributed to it distorts the resulting profit attribution and is a frequent point of dispute in financial-sector PE cases specifically.
Where Domestic Law Still Diverges from the AOA
Not every jurisdiction has adopted the AOA in its full form; some continue to apply older treaty language based on Article 7 of the pre-2010 OECD Model, which attributes profit based more narrowly on the actual activities of the PE without the full functionally-separate-entity fiction, or apply a relevant business activity approach limiting attribution to profits from the PE's specific line of business. Groups need to confirm which version of Article 7 governs the specific treaty in point before assuming the full AOA methodology applies, since the two frameworks can produce materially different attribution outcomes for the same PE.
Conclusion
PE profit attribution under the AOA is, in substance, a transfer pricing exercise conducted inside a single legal entity, turning on the same significant-people-functions and risk-control analysis that governs conventional intercompany dealings. Enterprises with PE exposure should run the two-step AOA analysis, and confirm which Article 7 framework their relevant treaty actually adopts, well before a revenue authority runs the same exercise unilaterally during an audit.
Once a foreign enterprise is found to have a permanent establishment (PE) in a jurisdiction, whether through a fixed place of business, a dependent agent, or increasingly a digital or service PE, a second and separate question arises: how much of the enterprise's profit should that PE be taxed on. The Authorised OECD Approach (AOA) answers this by treating the PE, functionally, as if it were a distinct and separate enterprise dealing with the rest of the head office on arm's length terms.
The Functionally Separate Entity Fiction
The AOA's central move is to apply the same functional, asset, and risk analysis used in conventional transfer pricing to the internal relationship between the PE and the rest of the enterprise, hypothesising a set of dealings between them as if they were separate legal entities. This is a genuine conceptual departure from the older, more mechanical formulary approaches some treaties and domestic laws still use, and it means a PE attribution exercise now largely mirrors a standard TP functional analysis, applied internally rather than across group entities.
Step One: The Functional and Factual Analysis
The first stage attributes to the PE the significant people functions actually performed there, meaning the people whose decisions genuinely create or manage risk and use assets, not merely administrative or support staff physically located at the PE. Where key decision-makers, such as traders taking on market risk or senior personnel negotiating material contracts, are located at the PE, the risks and assets associated with those decisions are attributed there even if formal legal documentation assigns them to the head office.
Step Two: Pricing the Internal Dealings
Once functions, assets, and risks are attributed, the second stage prices the notional dealings between the PE and the rest of the enterprise using conventional transfer pricing methods, CUP, cost-plus, TNMM, or profit split, exactly as would be applied to a genuine intercompany transaction. A PE that performs limited distribution functions on behalf of the head office would, under this fiction, be attributed a routine distributor-type return, while a PE housing the enterprise's key trading or decision-making function would be attributed a much larger share of overall profit.
Capital Attribution and Free Capital
Because a PE has no separate legal capital structure of its own, the AOA requires a notional allocation of 'free capital', capital not associated with a specific liability, sufficient to support the assets and risks attributed to it, using methods such as the capital allocation approach or a thin-capitalisation approach benchmarked against comparable independent enterprises in the same industry. Under-capitalising a PE relative to the risk profile attributed to it distorts the resulting profit attribution and is a frequent point of dispute in financial-sector PE cases specifically.
Where Domestic Law Still Diverges from the AOA
Not every jurisdiction has adopted the AOA in its full form; some continue to apply older treaty language based on Article 7 of the pre-2010 OECD Model, which attributes profit based more narrowly on the actual activities of the PE without the full functionally-separate-entity fiction, or apply a relevant business activity approach limiting attribution to profits from the PE's specific line of business. Groups need to confirm which version of Article 7 governs the specific treaty in point before assuming the full AOA methodology applies, since the two frameworks can produce materially different attribution outcomes for the same PE.
Conclusion
PE profit attribution under the AOA is, in substance, a transfer pricing exercise conducted inside a single legal entity, turning on the same significant-people-functions and risk-control analysis that governs conventional intercompany dealings. Enterprises with PE exposure should run the two-step AOA analysis, and confirm which Article 7 framework their relevant treaty actually adopts, well before a revenue authority runs the same exercise unilaterally during an audit.
Read More

Hard-to-Value Intangibles: Living with the Ex-Post Adjustment Mechanism
Hard-to-Value Intangibles: Living with the Ex-Post Adjustment Mechanism
Some intangibles are transferred, licensed, or contributed to a cost contribution arrangement at a stage where no reliable comparable exists and the future cash flows they will generate are genuinely uncertain. The OECD's hard-to-value intangibles (HTVI) provisions, folded into Chapter VI, give tax authorities a specific tool to test whether the price agreed at the time of transfer holds up once actual outcomes are known, and the mechanism catches more transactions than groups typically expect.
What Qualifies as an HTVI
An intangible is treated as hard-to-value where, at the time of the controlled transaction, no reliable comparables exist and the projections underlying the valuation, or the assumptions used to value it, are highly uncertain, making it difficult to assess the reliability of the price agreed at the outset. Early-stage pharmaceutical compounds, unproven software platforms, and partially developed technology are the classic examples, though the category is defined functionally rather than by industry, so any intangible priced primarily on unverifiable future projections can fall within it.
The Ex-Post Adjustment Logic
Where actual profits or cash flows generated by the intangible in the years following the transfer diverge significantly from the projections used to price it, tax authorities are permitted to treat that divergence as presumptive evidence that the original pricing was unreliable, and to adjust the transaction retrospectively using the actual outcomes as if they had been known at the time. This effectively shifts a portion of the valuation risk that would normally sit with the taxpayer's original projections onto an ex-post reconciliation the tax authority controls.
The Significant Divergence Threshold and Safe Harbours
Not every variance triggers an adjustment. The OECD framework and most implementing jurisdictions apply a materiality threshold, commonly a variance exceeding twenty percent from the original projection, before an ex-post adjustment is warranted, and provide limited safe harbours where the taxpayer can show the divergence resulted from unforeseeable events occurring after the transfer, or from the pre-agreed operation of a genuine price-adjustment clause built into the original arrangement. Groups relying on these carve-outs need to document, contemporaneously, the specific events claimed as unforeseeable.
Building in Contractual Protection
The most effective defence against an ex-post HTVI adjustment is a contractual price-adjustment clause negotiated at the time of the original transaction, of the kind independent parties routinely use for uncertain, milestone-dependent assets such as an unproven drug candidate or an early-stage platform. A properly structured milestone or royalty step-up clause converts what would otherwise be a unilateral tax authority reconstruction into the pre-agreed operation of commercial terms the taxpayer designed itself, which several jurisdictions explicitly recognise as taking the transaction outside the HTVI adjustment mechanism.
Documenting the Original Projections
Because the entire mechanism turns on comparing actual outcomes to original projections, the single most important HTVI defence is a contemporaneous file preserving exactly what was projected, on what assumptions, using what discount rate and probability-weighting methodology, at the time of the transfer. Reconstructing projections after the fact, once actual results are already known, invites exactly the scrutiny the HTVI rules were designed to apply, and materially weakens the taxpayer's ability to argue that a divergence was genuinely unforeseeable rather than a product of aggressive original assumptions.
Conclusion
The HTVI provisions do not create a new valuation method; they create a retrospective evidentiary test applied to intangibles that were, by definition, difficult to price reliably in the first place. Groups transferring early-stage or unproven intangibles should treat the original projection file and any milestone-based pricing clause as the primary defence, built before the transfer, not a reconstruction assembled once actual results have already diverged from plan.
Some intangibles are transferred, licensed, or contributed to a cost contribution arrangement at a stage where no reliable comparable exists and the future cash flows they will generate are genuinely uncertain. The OECD's hard-to-value intangibles (HTVI) provisions, folded into Chapter VI, give tax authorities a specific tool to test whether the price agreed at the time of transfer holds up once actual outcomes are known, and the mechanism catches more transactions than groups typically expect.
What Qualifies as an HTVI
An intangible is treated as hard-to-value where, at the time of the controlled transaction, no reliable comparables exist and the projections underlying the valuation, or the assumptions used to value it, are highly uncertain, making it difficult to assess the reliability of the price agreed at the outset. Early-stage pharmaceutical compounds, unproven software platforms, and partially developed technology are the classic examples, though the category is defined functionally rather than by industry, so any intangible priced primarily on unverifiable future projections can fall within it.
The Ex-Post Adjustment Logic
Where actual profits or cash flows generated by the intangible in the years following the transfer diverge significantly from the projections used to price it, tax authorities are permitted to treat that divergence as presumptive evidence that the original pricing was unreliable, and to adjust the transaction retrospectively using the actual outcomes as if they had been known at the time. This effectively shifts a portion of the valuation risk that would normally sit with the taxpayer's original projections onto an ex-post reconciliation the tax authority controls.
The Significant Divergence Threshold and Safe Harbours
Not every variance triggers an adjustment. The OECD framework and most implementing jurisdictions apply a materiality threshold, commonly a variance exceeding twenty percent from the original projection, before an ex-post adjustment is warranted, and provide limited safe harbours where the taxpayer can show the divergence resulted from unforeseeable events occurring after the transfer, or from the pre-agreed operation of a genuine price-adjustment clause built into the original arrangement. Groups relying on these carve-outs need to document, contemporaneously, the specific events claimed as unforeseeable.
Building in Contractual Protection
The most effective defence against an ex-post HTVI adjustment is a contractual price-adjustment clause negotiated at the time of the original transaction, of the kind independent parties routinely use for uncertain, milestone-dependent assets such as an unproven drug candidate or an early-stage platform. A properly structured milestone or royalty step-up clause converts what would otherwise be a unilateral tax authority reconstruction into the pre-agreed operation of commercial terms the taxpayer designed itself, which several jurisdictions explicitly recognise as taking the transaction outside the HTVI adjustment mechanism.
Documenting the Original Projections
Because the entire mechanism turns on comparing actual outcomes to original projections, the single most important HTVI defence is a contemporaneous file preserving exactly what was projected, on what assumptions, using what discount rate and probability-weighting methodology, at the time of the transfer. Reconstructing projections after the fact, once actual results are already known, invites exactly the scrutiny the HTVI rules were designed to apply, and materially weakens the taxpayer's ability to argue that a divergence was genuinely unforeseeable rather than a product of aggressive original assumptions.
Conclusion
The HTVI provisions do not create a new valuation method; they create a retrospective evidentiary test applied to intangibles that were, by definition, difficult to price reliably in the first place. Groups transferring early-stage or unproven intangibles should treat the original projection file and any milestone-based pricing clause as the primary defence, built before the transfer, not a reconstruction assembled once actual results have already diverged from plan.
Read More

DEMPE Analysis: Separating Legal Title from Economic Ownership of Intangibles
DEMPE Analysis: Separating Legal Title from Economic Ownership of Intangibles
Owning the legal title to a patent, trademark, or piece of know-how used to be treated as sufficient grounds for an entity to collect the resulting royalty income. Chapter VI of the OECD Guidelines rejected that shortcut. Under the DEMPE framework, the entity entitled to the return from an intangible is the one that actually performs and controls the Development, Enhancement, Maintenance, Protection and Exploitation functions associated with it, not necessarily the one whose name sits on the registration certificate.
Why Legal Ownership Stopped Being Decisive
Groups have long used low-tax IP-holding entities to hold legal title to valuable intangibles while the substantive R&D, brand-building, and commercialisation work continued to be carried out elsewhere in the group. BEPS Action 8 closed this gap by making clear that a legal owner with no DEMPE substance is entitled only to a routine return, typically a risk-free or risk-adjusted capital return, for the financing and legal-registration function it actually performs. The residual profit generated by the intangible flows instead to the entities that control the value-creating functions.
Mapping the Five DEMPE Functions
Development covers the creation of the intangible, R&D personnel, design decisions, and technical direction. Enhancement covers activities that increase the value of an existing intangible, including product improvements and line extensions. Maintenance preserves the intangible's value, defending a brand's quality standards or renewing a patent portfolio. Protection covers legal enforcement against infringement. Exploitation covers the commercial activities that convert the intangible into revenue, licensing negotiations, marketing campaigns, and manufacturing decisions built around it. Each function needs to be mapped to the specific entity and personnel actually performing it, not the entity contractually assigned responsibility for it.
Control Over Risk Is the Real Test
The OECD's guidance places particular weight on control, meaning the capability and actual exercise of decision-making authority over a DEMPE function, and financial capacity to bear the associated risk. An entity that merely funds R&D without any capability to evaluate, direct, or manage the research it is paying for is not controlling the development risk, even if it legally bears the cost. This mirrors the broader Chapter I risk-control framework and means a DEMPE analysis cannot be completed in isolation from the group's wider risk delineation exercise.
Marketing Intangibles and the Distributor Problem
DEMPE disputes are especially common where a local distributor invests heavily in advertising and local marketing that builds brand value legally owned by an offshore parent. Whether that local marketing spend entitles the distributor to a share of the resulting marketing intangible return depends on whether the spend is routine, in line with what an independent distributor would incur to sell the product, or exceeds that baseline in a way that itself builds transferable brand equity. Distinguishing the two requires benchmarking the distributor's marketing intensity against independent comparables in the same industry.
Building the DEMPE Documentation File
A defensible DEMPE file identifies every intangible material to the group, traces each of the five functions to the entity and personnel performing it, evidences the decision-making authority through board minutes, R&D governance records, and personnel organisation charts, and reconciles the resulting functional map against the group's existing intercompany agreements and royalty flows. Where the map and the agreements diverge, the agreements need to be revised or the royalty flows will not withstand a DEMPE-based audit challenge, since tax authorities now build this analysis into nearly every intangible-related transfer pricing review.
Conclusion
Chapter VI's DEMPE framework has permanently shifted the burden of proof for intangible-related returns from a registration certificate to a documented functional and control analysis. Groups holding intangibles in a low-substance IP entity should test that entity's DEMPE footprint against its royalty income now, rather than waiting for a tax authority to run the same test during an audit and find the gap first.
Owning the legal title to a patent, trademark, or piece of know-how used to be treated as sufficient grounds for an entity to collect the resulting royalty income. Chapter VI of the OECD Guidelines rejected that shortcut. Under the DEMPE framework, the entity entitled to the return from an intangible is the one that actually performs and controls the Development, Enhancement, Maintenance, Protection and Exploitation functions associated with it, not necessarily the one whose name sits on the registration certificate.
Why Legal Ownership Stopped Being Decisive
Groups have long used low-tax IP-holding entities to hold legal title to valuable intangibles while the substantive R&D, brand-building, and commercialisation work continued to be carried out elsewhere in the group. BEPS Action 8 closed this gap by making clear that a legal owner with no DEMPE substance is entitled only to a routine return, typically a risk-free or risk-adjusted capital return, for the financing and legal-registration function it actually performs. The residual profit generated by the intangible flows instead to the entities that control the value-creating functions.
Mapping the Five DEMPE Functions
Development covers the creation of the intangible, R&D personnel, design decisions, and technical direction. Enhancement covers activities that increase the value of an existing intangible, including product improvements and line extensions. Maintenance preserves the intangible's value, defending a brand's quality standards or renewing a patent portfolio. Protection covers legal enforcement against infringement. Exploitation covers the commercial activities that convert the intangible into revenue, licensing negotiations, marketing campaigns, and manufacturing decisions built around it. Each function needs to be mapped to the specific entity and personnel actually performing it, not the entity contractually assigned responsibility for it.
Control Over Risk Is the Real Test
The OECD's guidance places particular weight on control, meaning the capability and actual exercise of decision-making authority over a DEMPE function, and financial capacity to bear the associated risk. An entity that merely funds R&D without any capability to evaluate, direct, or manage the research it is paying for is not controlling the development risk, even if it legally bears the cost. This mirrors the broader Chapter I risk-control framework and means a DEMPE analysis cannot be completed in isolation from the group's wider risk delineation exercise.
Marketing Intangibles and the Distributor Problem
DEMPE disputes are especially common where a local distributor invests heavily in advertising and local marketing that builds brand value legally owned by an offshore parent. Whether that local marketing spend entitles the distributor to a share of the resulting marketing intangible return depends on whether the spend is routine, in line with what an independent distributor would incur to sell the product, or exceeds that baseline in a way that itself builds transferable brand equity. Distinguishing the two requires benchmarking the distributor's marketing intensity against independent comparables in the same industry.
Building the DEMPE Documentation File
A defensible DEMPE file identifies every intangible material to the group, traces each of the five functions to the entity and personnel performing it, evidences the decision-making authority through board minutes, R&D governance records, and personnel organisation charts, and reconciles the resulting functional map against the group's existing intercompany agreements and royalty flows. Where the map and the agreements diverge, the agreements need to be revised or the royalty flows will not withstand a DEMPE-based audit challenge, since tax authorities now build this analysis into nearly every intangible-related transfer pricing review.
Conclusion
Chapter VI's DEMPE framework has permanently shifted the burden of proof for intangible-related returns from a registration certificate to a documented functional and control analysis. Groups holding intangibles in a low-substance IP entity should test that entity's DEMPE footprint against its royalty income now, rather than waiting for a tax authority to run the same test during an audit and find the gap first.
Read More

Mutual Agreement Procedure and Multilateral APAs: Resolving Double Taxation Disputes
Mutual Agreement Procedure and Multilateral APAs: Resolving Double Taxation Disputes
A transfer pricing adjustment in one country does not automatically create a corresponding relief in the counterparty jurisdiction. Left unresolved, a unilateral TP adjustment simply means the same income is taxed twice, once in the adjusting jurisdiction, and again in the counterparty jurisdiction that has not made a matching downward adjustment. The Mutual Agreement Procedure (MAP), built into most bilateral tax treaties, and the multilateral Advance Pricing Agreement (APA), are the two principal mechanisms available to prevent or resolve that outcome.
How MAP Works
MAP allows a taxpayer facing double taxation arising from a transfer pricing adjustment to request that the competent authorities of the two treaty jurisdictions negotiate directly with each other to eliminate the double taxation, either by the adjusting country reducing or withdrawing its adjustment, or by the counterparty country granting a corresponding adjustment recognising the revised allocation of profit. MAP is a government-to-government negotiation, the taxpayer requests access to the process and provides supporting information, but does not directly participate in the negotiation between the two competent authorities.
The Statistics Problem: Time and Uncertainty
Historically, MAP's greatest practical weakness has been resolution time, with cases in complex transfer pricing disputes routinely taking multiple years to close, creating prolonged uncertainty and, in many cases, requiring the taxpayer to fund cash-flow costs (paying tax in the adjusting jurisdiction while awaiting relief) for years before resolution. BEPS Action 14 introduced minimum standards intended to improve MAP timeliness and access, including peer review monitoring of competent authorities' MAP statistics, though outcomes still vary substantially by jurisdiction pair.
Bilateral and Multilateral APAs as Pre-Emptive MAP
An Advance Pricing Agreement negotiated bilaterally or multilaterally between the taxpayer and two or more tax authorities achieves, prospectively, what MAP achieves retrospectively, an agreed transfer pricing methodology that both jurisdictions commit to accepting for a defined future period, eliminating double taxation risk before it arises rather than resolving it after an adjustment has already been made. Multilateral APAs extend this certainty across more than two jurisdictions simultaneously, which is particularly valuable for group-wide arrangements like centralised intangible licensing or global cash pooling that touch many countries at once but would otherwise require a separate bilateral negotiation with each.
Choosing Between MAP and APA as a Strategic Decision
For an existing dispute already under audit, MAP is generally the only available route. For a prospective arrangement not yet under dispute, an APA, despite requiring significant upfront investment in preparation and negotiation time, is generally the more cost-effective route to long-term certainty, particularly for high-value, recurring related-party transactions such as intangible licensing, intra-group financing, or a group's core manufacturing-to-distribution supply chain. Several jurisdictions, India among them, have publicly signalled a policy preference for proactive APA filing over reactive audit defence, reflected in accelerating APA volumes and materially faster average resolution times for APA-covered positions compared to litigated ones.
Preparing for Either Route
Whether a group ultimately pursues MAP or an APA, the underlying preparation overlaps substantially: a clearly documented functional and risk analysis, a defensible benchmarking methodology, and financial data organised in a form that can be presented consistently to more than one competent authority at once. Groups that maintain this documentation on an ongoing basis, rather than assembling it only once a dispute or negotiation is already underway, are far better positioned to move quickly through either process when the need arises.
Conclusion
MAP resolves double taxation under the relevant tax treaty's corresponding-adjustment article after a primary adjustment has already occurred, while a bilateral or multilateral APA fixes the accepted methodology under Chapter IV before a dispute can arise, and the two mechanisms should be chosen based on where a transaction currently sits in its lifecycle. For recurring, high-value related-party transactions, a group's default position should be a prospective APA, with MAP reserved for transactions and years an APA does not already cover.
A transfer pricing adjustment in one country does not automatically create a corresponding relief in the counterparty jurisdiction. Left unresolved, a unilateral TP adjustment simply means the same income is taxed twice, once in the adjusting jurisdiction, and again in the counterparty jurisdiction that has not made a matching downward adjustment. The Mutual Agreement Procedure (MAP), built into most bilateral tax treaties, and the multilateral Advance Pricing Agreement (APA), are the two principal mechanisms available to prevent or resolve that outcome.
How MAP Works
MAP allows a taxpayer facing double taxation arising from a transfer pricing adjustment to request that the competent authorities of the two treaty jurisdictions negotiate directly with each other to eliminate the double taxation, either by the adjusting country reducing or withdrawing its adjustment, or by the counterparty country granting a corresponding adjustment recognising the revised allocation of profit. MAP is a government-to-government negotiation, the taxpayer requests access to the process and provides supporting information, but does not directly participate in the negotiation between the two competent authorities.
The Statistics Problem: Time and Uncertainty
Historically, MAP's greatest practical weakness has been resolution time, with cases in complex transfer pricing disputes routinely taking multiple years to close, creating prolonged uncertainty and, in many cases, requiring the taxpayer to fund cash-flow costs (paying tax in the adjusting jurisdiction while awaiting relief) for years before resolution. BEPS Action 14 introduced minimum standards intended to improve MAP timeliness and access, including peer review monitoring of competent authorities' MAP statistics, though outcomes still vary substantially by jurisdiction pair.
Bilateral and Multilateral APAs as Pre-Emptive MAP
An Advance Pricing Agreement negotiated bilaterally or multilaterally between the taxpayer and two or more tax authorities achieves, prospectively, what MAP achieves retrospectively, an agreed transfer pricing methodology that both jurisdictions commit to accepting for a defined future period, eliminating double taxation risk before it arises rather than resolving it after an adjustment has already been made. Multilateral APAs extend this certainty across more than two jurisdictions simultaneously, which is particularly valuable for group-wide arrangements like centralised intangible licensing or global cash pooling that touch many countries at once but would otherwise require a separate bilateral negotiation with each.
Choosing Between MAP and APA as a Strategic Decision
For an existing dispute already under audit, MAP is generally the only available route. For a prospective arrangement not yet under dispute, an APA, despite requiring significant upfront investment in preparation and negotiation time, is generally the more cost-effective route to long-term certainty, particularly for high-value, recurring related-party transactions such as intangible licensing, intra-group financing, or a group's core manufacturing-to-distribution supply chain. Several jurisdictions, India among them, have publicly signalled a policy preference for proactive APA filing over reactive audit defence, reflected in accelerating APA volumes and materially faster average resolution times for APA-covered positions compared to litigated ones.
Preparing for Either Route
Whether a group ultimately pursues MAP or an APA, the underlying preparation overlaps substantially: a clearly documented functional and risk analysis, a defensible benchmarking methodology, and financial data organised in a form that can be presented consistently to more than one competent authority at once. Groups that maintain this documentation on an ongoing basis, rather than assembling it only once a dispute or negotiation is already underway, are far better positioned to move quickly through either process when the need arises.
Conclusion
MAP resolves double taxation under the relevant tax treaty's corresponding-adjustment article after a primary adjustment has already occurred, while a bilateral or multilateral APA fixes the accepted methodology under Chapter IV before a dispute can arise, and the two mechanisms should be chosen based on where a transaction currently sits in its lifecycle. For recurring, high-value related-party transactions, a group's default position should be a prospective APA, with MAP reserved for transactions and years an APA does not already cover.
Read More

Business Restructuring in Transfer Pricing: Compensating for What Was Given Up
Business Restructuring in Transfer Pricing: Compensating for What Was Given Up
When a multinational group converts a full-fledged distributor into a limited-risk distributor, centralises a previously local manufacturing function, or migrates valuable intangibles from a local entity to a central IP-holding company, it is undertaking a business restructuring, and Chapter IX of the OECD Guidelines treats these conversions as transactions in their own right, distinct from the ongoing pricing of the restructured entity's post-conversion activities. The question is not only whether the new arrangement is priced at arm's length going forward, but whether the entity that gave something up in the restructuring itself was properly compensated for what it lost.
What Counts as a Business Restructuring
The OECD's Chapter IX guidance treats business restructuring broadly as any cross-border redeployment of functions, assets or risks by a multinational group, whether or not accompanied by a transfer of tangible or intangible assets. The classic examples are converting a full-risk distributor into a limited-risk distributor or commissionaire, converting a manufacturer into a contract or toll manufacturer, or centralising an intangible previously developed and exploited locally into a group IP-holding entity, each of which typically reduces the profit potential the converted entity can expect to earn going forward.
The Two Distinct Questions
Business restructuring analysis separates cleanly into two questions that should not be conflated. First: was the restructuring transaction itself, the conversion event, appropriately compensated, given what the local entity gave up (profit potential, existing customer relationships, or an intangible transferred to the new structure)? Second, entirely separately: is the restructured entity's ongoing remuneration, post-conversion, consistent with arm's length principles for the (now more limited) functions it performs? A group can get the second question right while badly mishandling the first, and tax authorities increasingly test both independently.
Exit Charges and Compensation for Relinquished Profit Potential
Where a restructuring results in the transfer of something of value, a customer relationship, an assembled workforce, a distribution network, or an intangible, the entity giving it up is generally entitled to compensation reflecting the value transferred, commonly referred to as an exit charge. Quantifying this is genuinely difficult: valuing a customer relationship or a distribution network that has no observable market price requires either a discounted cash flow of foregone future profits or a comparison to third-party transactions where similar rights or relationships changed hands, and both approaches involve significant estimation.
The Commercial Rationale Test
Tax authorities reviewing a restructuring will typically ask whether the arrangement makes commercial sense from the perspective of each party viewed separately, not just from the group's consolidated perspective, since an entity would not rationally give up a profitable function or valuable relationship without either fair compensation or a genuine, non-tax business reason for doing so. A restructuring implemented primarily to reduce the group's overall effective tax rate, without a credible independent business rationale and without adequate exit compensation to the entity relinquishing profit potential, is one of the most heavily scrutinised categories of transfer pricing transaction globally.
Sequencing the Restructuring and the Documentation
The strongest restructuring files are built contemporaneously, with the commercial rationale, valuation of relinquished profit potential, and exit compensation all documented before the conversion takes effect, rather than reconstructed afterward once the restructured entity's lower margins have already drawn attention. Groups planning a restructuring should treat the exit compensation analysis as a precondition to implementation, sequenced alongside legal and operational planning rather than tackled only once the new structure is already live.
Conclusion
Chapter IX requires a business restructuring to be tested on two separate transfer pricing questions, the arm's length compensation for what was relinquished at conversion, and the arm's length remuneration of the restructured entity's ongoing, reduced functions, and a group that only addresses the second question leaves the first entirely unpriced. Exit compensation for lost profit potential needs its own contemporaneous valuation, completed before the restructuring takes effect, not reconstructed once the lower post-conversion margins have already drawn audit attention.
When a multinational group converts a full-fledged distributor into a limited-risk distributor, centralises a previously local manufacturing function, or migrates valuable intangibles from a local entity to a central IP-holding company, it is undertaking a business restructuring, and Chapter IX of the OECD Guidelines treats these conversions as transactions in their own right, distinct from the ongoing pricing of the restructured entity's post-conversion activities. The question is not only whether the new arrangement is priced at arm's length going forward, but whether the entity that gave something up in the restructuring itself was properly compensated for what it lost.
What Counts as a Business Restructuring
The OECD's Chapter IX guidance treats business restructuring broadly as any cross-border redeployment of functions, assets or risks by a multinational group, whether or not accompanied by a transfer of tangible or intangible assets. The classic examples are converting a full-risk distributor into a limited-risk distributor or commissionaire, converting a manufacturer into a contract or toll manufacturer, or centralising an intangible previously developed and exploited locally into a group IP-holding entity, each of which typically reduces the profit potential the converted entity can expect to earn going forward.
The Two Distinct Questions
Business restructuring analysis separates cleanly into two questions that should not be conflated. First: was the restructuring transaction itself, the conversion event, appropriately compensated, given what the local entity gave up (profit potential, existing customer relationships, or an intangible transferred to the new structure)? Second, entirely separately: is the restructured entity's ongoing remuneration, post-conversion, consistent with arm's length principles for the (now more limited) functions it performs? A group can get the second question right while badly mishandling the first, and tax authorities increasingly test both independently.
Exit Charges and Compensation for Relinquished Profit Potential
Where a restructuring results in the transfer of something of value, a customer relationship, an assembled workforce, a distribution network, or an intangible, the entity giving it up is generally entitled to compensation reflecting the value transferred, commonly referred to as an exit charge. Quantifying this is genuinely difficult: valuing a customer relationship or a distribution network that has no observable market price requires either a discounted cash flow of foregone future profits or a comparison to third-party transactions where similar rights or relationships changed hands, and both approaches involve significant estimation.
The Commercial Rationale Test
Tax authorities reviewing a restructuring will typically ask whether the arrangement makes commercial sense from the perspective of each party viewed separately, not just from the group's consolidated perspective, since an entity would not rationally give up a profitable function or valuable relationship without either fair compensation or a genuine, non-tax business reason for doing so. A restructuring implemented primarily to reduce the group's overall effective tax rate, without a credible independent business rationale and without adequate exit compensation to the entity relinquishing profit potential, is one of the most heavily scrutinised categories of transfer pricing transaction globally.
Sequencing the Restructuring and the Documentation
The strongest restructuring files are built contemporaneously, with the commercial rationale, valuation of relinquished profit potential, and exit compensation all documented before the conversion takes effect, rather than reconstructed afterward once the restructured entity's lower margins have already drawn attention. Groups planning a restructuring should treat the exit compensation analysis as a precondition to implementation, sequenced alongside legal and operational planning rather than tackled only once the new structure is already live.
Conclusion
Chapter IX requires a business restructuring to be tested on two separate transfer pricing questions, the arm's length compensation for what was relinquished at conversion, and the arm's length remuneration of the restructured entity's ongoing, reduced functions, and a group that only addresses the second question leaves the first entirely unpriced. Exit compensation for lost profit potential needs its own contemporaneous valuation, completed before the restructuring takes effect, not reconstructed once the lower post-conversion margins have already drawn audit attention.
Read More

Cash Pooling and Treasury Centres: The Transfer Pricing of Group Liquidity
Cash Pooling and Treasury Centres: The Transfer Pricing of Group Liquidity
Centralised treasury functions, cash pools, in-house banks, and group financing entities, are among the most common intra-group financial arrangements, and among the most frequently mispriced. Because cash pooling looks operationally simple (money moves between accounts to net out group-wide liquidity needs), it is tempting to treat the pricing of it as an afterthought. Tax authorities increasingly do not share that view.
What a Cash Pool Actually Does
In a notional or physical cash pool, participating group entities' bank balances are aggregated, either notionally, for interest calculation purposes, or physically, through actual cash sweeps, allowing the group to net short-term cash surpluses in one entity against cash deficits in another, reducing overall external borrowing costs and often earning a better blended interest outcome than each entity could achieve independently at a standalone bank. The pool leader, typically a treasury centre, coordinates the arrangement and often earns a spread between the rates offered to depositor and borrower participants.
Pricing the Pool Leader's Function
The central transfer pricing question is what the pool leader should be compensated for performing, and the answer depends heavily on what functions and risks it actually assumes. A pool leader that performs a purely administrative, coordination role (calculating balances, arranging sweeps) should earn a modest service fee reflecting that limited function. A pool leader that takes on genuine credit risk, guaranteeing deposits, absorbing the risk of a participant's negative balance, or providing liquidity beyond what the pool's net position would otherwise support, is performing a treasury/banking-like function and should be compensated accordingly, typically through an interest margin rather than a flat fee.
Depositor and Borrower Rates Within the Pool
Participants contributing surplus cash to the pool (depositors) and those drawing on it (borrowers) should each receive rates that reflect what they could achieve independently in the market for short-term deposits and borrowings respectively, not simply a single blended rate applied uniformly across all participants regardless of their individual credit profile. A high-credit-quality participant contributing surplus cash should not be forced to accept the same low deposit rate as a lower-rated participant, and a lower-rated borrower drawing from the pool should not automatically receive the group's best borrowing rate purely by virtue of pool membership, unless the pooling arrangement itself is structured to genuinely pass that benefit through as part of the arm's length bargain.
Synergy Benefits and Who Keeps Them
Cash pooling generates a genuine synergy benefit, since the group as a whole typically achieves a better net interest outcome than the sum of what each entity could achieve standalone, and the allocation of that synergy benefit among participants and the pool leader is itself a transfer pricing question. OECD guidance under Chapter X indicates the synergy benefit should generally be shared among participants in a manner consistent with what independent parties would negotiate, rather than being captured entirely by the pool leader or by whichever entity happens to hold the strongest bargaining position within the group.
Short-Term vs Long-Term Positions Within the Pool
A participant that consistently maintains a large positive or negative balance within the pool over an extended period is, in substance, providing or receiving longer-term financing rather than genuine short-term liquidity management, and tax authorities increasingly test whether persistently large pool balances should be recharacterised and separately priced as term loans rather than left folded into the pool's short-term interest mechanics. Groups should monitor participant balances for exactly this pattern and consider converting a chronically large position into a formally documented intercompany loan before an audit forces the recharacterisation.
Conclusion
Cash pool pricing under Chapter X turns on a single functional question, whether the pool leader bears genuine credit risk or performs a purely administrative coordination role, since that determines whether compensation should be a service fee or an interest margin. Depositor and borrower rates within the pool should be benchmarked to each participant's standalone credit profile, and any persistently large pool balance should be tested for recharacterisation as a term loan before an audit forces the point.
Centralised treasury functions, cash pools, in-house banks, and group financing entities, are among the most common intra-group financial arrangements, and among the most frequently mispriced. Because cash pooling looks operationally simple (money moves between accounts to net out group-wide liquidity needs), it is tempting to treat the pricing of it as an afterthought. Tax authorities increasingly do not share that view.
What a Cash Pool Actually Does
In a notional or physical cash pool, participating group entities' bank balances are aggregated, either notionally, for interest calculation purposes, or physically, through actual cash sweeps, allowing the group to net short-term cash surpluses in one entity against cash deficits in another, reducing overall external borrowing costs and often earning a better blended interest outcome than each entity could achieve independently at a standalone bank. The pool leader, typically a treasury centre, coordinates the arrangement and often earns a spread between the rates offered to depositor and borrower participants.
Pricing the Pool Leader's Function
The central transfer pricing question is what the pool leader should be compensated for performing, and the answer depends heavily on what functions and risks it actually assumes. A pool leader that performs a purely administrative, coordination role (calculating balances, arranging sweeps) should earn a modest service fee reflecting that limited function. A pool leader that takes on genuine credit risk, guaranteeing deposits, absorbing the risk of a participant's negative balance, or providing liquidity beyond what the pool's net position would otherwise support, is performing a treasury/banking-like function and should be compensated accordingly, typically through an interest margin rather than a flat fee.
Depositor and Borrower Rates Within the Pool
Participants contributing surplus cash to the pool (depositors) and those drawing on it (borrowers) should each receive rates that reflect what they could achieve independently in the market for short-term deposits and borrowings respectively, not simply a single blended rate applied uniformly across all participants regardless of their individual credit profile. A high-credit-quality participant contributing surplus cash should not be forced to accept the same low deposit rate as a lower-rated participant, and a lower-rated borrower drawing from the pool should not automatically receive the group's best borrowing rate purely by virtue of pool membership, unless the pooling arrangement itself is structured to genuinely pass that benefit through as part of the arm's length bargain.
Synergy Benefits and Who Keeps Them
Cash pooling generates a genuine synergy benefit, since the group as a whole typically achieves a better net interest outcome than the sum of what each entity could achieve standalone, and the allocation of that synergy benefit among participants and the pool leader is itself a transfer pricing question. OECD guidance under Chapter X indicates the synergy benefit should generally be shared among participants in a manner consistent with what independent parties would negotiate, rather than being captured entirely by the pool leader or by whichever entity happens to hold the strongest bargaining position within the group.
Short-Term vs Long-Term Positions Within the Pool
A participant that consistently maintains a large positive or negative balance within the pool over an extended period is, in substance, providing or receiving longer-term financing rather than genuine short-term liquidity management, and tax authorities increasingly test whether persistently large pool balances should be recharacterised and separately priced as term loans rather than left folded into the pool's short-term interest mechanics. Groups should monitor participant balances for exactly this pattern and consider converting a chronically large position into a formally documented intercompany loan before an audit forces the recharacterisation.
Conclusion
Cash pool pricing under Chapter X turns on a single functional question, whether the pool leader bears genuine credit risk or performs a purely administrative coordination role, since that determines whether compensation should be a service fee or an interest margin. Depositor and borrower rates within the pool should be benchmarked to each participant's standalone credit profile, and any persistently large pool balance should be tested for recharacterisation as a term loan before an audit forces the point.
Read More

Transfer Pricing Meets Customs Valuation: Two Regimes, One Transaction, Different Answers
Transfer Pricing Meets Customs Valuation: Two Regimes, One Transaction, Different Answers
A single cross-border sale of goods between related parties is simultaneously subject to two distinct valuation regimes that were never designed to talk to each other. Transfer pricing law asks whether the price reflects an arm's length return given the functions, assets, and risks of the parties. Customs valuation law, under the WTO Customs Valuation Agreement, asks whether the declared transaction value reflects the price actually paid or payable for the goods, adjusted for specific statutory additions and deductions. These two questions can, and frequently do, produce different answers for the same invoice.
Why the Objectives Diverge
Transfer pricing authorities generally want to see higher declared profit (and by extension, often a higher import price, since a higher price paid for imported goods can compress the importer's margin) attributed to their jurisdiction, particularly where the importer is a distributor in a high-tax, revenue-hungry market. Customs authorities, conversely, generally want to see a higher declared import value, since customs duty is typically assessed on the transaction value of the imported goods, meaning a lower transfer price can reduce duty exposure even as it potentially triggers a transfer pricing adjustment in the other direction. The two authorities' incentives on the same price point are frequently opposed to each other.
Retroactive TP Adjustments and Customs Consequences
A year-end transfer pricing true-up, a common feature of TNMM-based intercompany pricing policies designed to land the tested party's margin within an arm's length range, creates a genuine practical problem for customs compliance. If the true-up increases the price of goods already imported and cleared through customs at a lower declared value, the importer may need to file a retroactive customs value adjustment and pay additional duty; if the true-up decreases the price, the importer may be entitled to a duty refund, but few customs administrations process these refunds as a matter of routine, and many require a specific claim procedure with its own evidentiary standard.
The WCO-OECD Guidance and Its Limits
The World Customs Organization and OECD have jointly published guidance encouraging customs and tax authorities to use each other's documentation, transfer pricing studies as evidence supporting customs valuation, and customs declarations as evidence in transfer pricing benchmarking, but this guidance is not binding, and in practice the two authorities within the same country frequently do not coordinate, let alone across borders. A transfer pricing study accepted by the income tax authority carries no guarantee of acceptance by the customs authority reviewing the same transaction.
Practical Steps for Groups with Related-Party Import Flows
Groups with significant related-party goods trade should build a formal reconciliation process between their TP policy and customs declarations, ideally involving both tax and customs and trade compliance teams in the design of any year-end adjustment mechanism, and should evaluate whether First Sale for Export or other customs valuation methodologies might reduce the friction between the two positions. Where a retroactive TP adjustment is contractually built into the intercompany agreement, the agreement should also address how and when the corresponding customs value adjustment will be filed, rather than leaving that as an afterthought once the tax adjustment has already been booked.
The Advance Ruling Option
Some customs administrations offer advance ruling programmes allowing an importer to obtain binding confirmation of an accepted valuation methodology before transactions occur, functioning as a customs-side counterpart to a transfer pricing Advance Pricing Agreement. For groups with high-value, high-volume related-party import flows, pursuing an advance customs ruling alongside an APA on the income tax side can meaningfully reduce the residual uncertainty that even the best-documented reconciliation process cannot fully eliminate.
Conclusion
Transfer pricing and customs valuation apply different legal tests to the same invoice, an arm's length return under Chapter I against a declared transaction value under the WTO Customs Valuation Agreement, and no OECD or WCO guidance currently binds the two together. Any year-end TNMM true-up built into an intercompany pricing policy needs its own customs value adjustment mechanism specified in the intercompany agreement, or the transfer pricing position and the customs declaration will diverge by design.
A single cross-border sale of goods between related parties is simultaneously subject to two distinct valuation regimes that were never designed to talk to each other. Transfer pricing law asks whether the price reflects an arm's length return given the functions, assets, and risks of the parties. Customs valuation law, under the WTO Customs Valuation Agreement, asks whether the declared transaction value reflects the price actually paid or payable for the goods, adjusted for specific statutory additions and deductions. These two questions can, and frequently do, produce different answers for the same invoice.
Why the Objectives Diverge
Transfer pricing authorities generally want to see higher declared profit (and by extension, often a higher import price, since a higher price paid for imported goods can compress the importer's margin) attributed to their jurisdiction, particularly where the importer is a distributor in a high-tax, revenue-hungry market. Customs authorities, conversely, generally want to see a higher declared import value, since customs duty is typically assessed on the transaction value of the imported goods, meaning a lower transfer price can reduce duty exposure even as it potentially triggers a transfer pricing adjustment in the other direction. The two authorities' incentives on the same price point are frequently opposed to each other.
Retroactive TP Adjustments and Customs Consequences
A year-end transfer pricing true-up, a common feature of TNMM-based intercompany pricing policies designed to land the tested party's margin within an arm's length range, creates a genuine practical problem for customs compliance. If the true-up increases the price of goods already imported and cleared through customs at a lower declared value, the importer may need to file a retroactive customs value adjustment and pay additional duty; if the true-up decreases the price, the importer may be entitled to a duty refund, but few customs administrations process these refunds as a matter of routine, and many require a specific claim procedure with its own evidentiary standard.
The WCO-OECD Guidance and Its Limits
The World Customs Organization and OECD have jointly published guidance encouraging customs and tax authorities to use each other's documentation, transfer pricing studies as evidence supporting customs valuation, and customs declarations as evidence in transfer pricing benchmarking, but this guidance is not binding, and in practice the two authorities within the same country frequently do not coordinate, let alone across borders. A transfer pricing study accepted by the income tax authority carries no guarantee of acceptance by the customs authority reviewing the same transaction.
Practical Steps for Groups with Related-Party Import Flows
Groups with significant related-party goods trade should build a formal reconciliation process between their TP policy and customs declarations, ideally involving both tax and customs and trade compliance teams in the design of any year-end adjustment mechanism, and should evaluate whether First Sale for Export or other customs valuation methodologies might reduce the friction between the two positions. Where a retroactive TP adjustment is contractually built into the intercompany agreement, the agreement should also address how and when the corresponding customs value adjustment will be filed, rather than leaving that as an afterthought once the tax adjustment has already been booked.
The Advance Ruling Option
Some customs administrations offer advance ruling programmes allowing an importer to obtain binding confirmation of an accepted valuation methodology before transactions occur, functioning as a customs-side counterpart to a transfer pricing Advance Pricing Agreement. For groups with high-value, high-volume related-party import flows, pursuing an advance customs ruling alongside an APA on the income tax side can meaningfully reduce the residual uncertainty that even the best-documented reconciliation process cannot fully eliminate.
Conclusion
Transfer pricing and customs valuation apply different legal tests to the same invoice, an arm's length return under Chapter I against a declared transaction value under the WTO Customs Valuation Agreement, and no OECD or WCO guidance currently binds the two together. Any year-end TNMM true-up built into an intercompany pricing policy needs its own customs value adjustment mechanism specified in the intercompany agreement, or the transfer pricing position and the customs declaration will diverge by design.
Read More

Comparability Adjustments: Working Capital, Risk, and Cross-GAAP Adjustments
Comparability Adjustments: Working Capital, Risk, and Cross-GAAP Adjustments
Perfect comparables do not exist. Every benchmarking study, however carefully filtered, ends up with a comparable set that differs from the tested party in some material respect, different working capital intensity, different risk profiles, or, increasingly common as benchmarking sets expand across jurisdictions, different accounting standards altogether. Comparability adjustments exist to correct for these differences and are, in practice, where much of the real analytical judgment in a benchmarking study is exercised.
Working Capital Adjustments
Where the tested party and its comparables carry materially different levels of receivables, payables, or inventory relative to sales, the imputed interest cost or benefit of that difference distorts an otherwise valid margin comparison, a comparable with much higher receivables is effectively extending more free financing to its customers than the tested party, which should be reflected in a lower expected margin, all else equal. The standard adjustment imputes an interest rate to the net working capital differential and adjusts the comparable's margin accordingly, typically using a short-term borrowing or lending rate appropriate to the comparable's currency and market.
Risk Adjustments
Where a limited-risk tested party is being benchmarked against comparables that, despite passing functional filters, appear to bear materially more market, credit, or inventory risk in substance, a risk adjustment can be applied to bring the comparable set's expected return closer to what a lower-risk entity would command. Risk adjustments are inherently more judgment-intensive than working capital adjustments because risk is harder to quantify from public financial statements alone, and tax authorities scrutinise them more closely as a result, a risk adjustment without clear, quantifiable evidence of the risk differential is one of the more frequently disallowed adjustments in practice.
Cross-GAAP Adjustments
As benchmarking searches increasingly draw comparables from multiple jurisdictions to find an adequate sample size, differences in accounting standards between the tested party's jurisdiction and the comparables' home jurisdictions become a real source of margin distortion. A frequently encountered example is lease accounting: under IFRS 16 and similar standards, operating leases are capitalised onto the balance sheet with a corresponding depreciation and interest expense pattern, while under standards without a mandatory equivalent, lease payments remain a straight operating expense, producing structurally different operating margins for otherwise functionally similar comparables purely as an artefact of which accounting regime they report under, unrelated to any genuine difference in economic performance.
Materiality and the Documentation Standard
Not every difference warrants an adjustment. The OECD Guidelines caution against making adjustments for every conceivable comparability defect, since each adjustment introduces its own layer of estimation error, and a study with numerous small adjustments can end up less reliable than one with a slightly imperfect but unadjusted comparable set. The practical standard is to adjust only for differences that are material, quantifiable with reasonable reliability, and clearly linked to an economic driver of the margin being tested, and to document the adjustment methodology transparently enough that a reviewing tax authority can replicate the calculation.
A Consistent Adjustment Policy Across Years
Tax authorities frequently notice, and query, a group that applies a comparability adjustment in one filing year and abandons it the next without a clear change in underlying facts. Establishing a consistent, documented adjustment policy applied year over year, and revisiting that policy only when the underlying comparability driver genuinely changes, lends considerably more credibility to the benchmarking study than an ad hoc approach chosen fresh each year based on which adjustment happens to produce the most convenient result.
Conclusion
Working capital, risk and cross-GAAP adjustments are only defensible where the underlying comparability defect is material, quantifiable, and consistently applied across filing years, per the materiality standard set out in Chapter III. A benchmarking study that either ignores a material accounting-standard difference, such as IFRS 16 lease capitalisation against a non-mandatory-capitalisation regime, or over-adjusts a comparable set beyond what the evidence supports, fails the same reliability test from opposite directions.
Perfect comparables do not exist. Every benchmarking study, however carefully filtered, ends up with a comparable set that differs from the tested party in some material respect, different working capital intensity, different risk profiles, or, increasingly common as benchmarking sets expand across jurisdictions, different accounting standards altogether. Comparability adjustments exist to correct for these differences and are, in practice, where much of the real analytical judgment in a benchmarking study is exercised.
Working Capital Adjustments
Where the tested party and its comparables carry materially different levels of receivables, payables, or inventory relative to sales, the imputed interest cost or benefit of that difference distorts an otherwise valid margin comparison, a comparable with much higher receivables is effectively extending more free financing to its customers than the tested party, which should be reflected in a lower expected margin, all else equal. The standard adjustment imputes an interest rate to the net working capital differential and adjusts the comparable's margin accordingly, typically using a short-term borrowing or lending rate appropriate to the comparable's currency and market.
Risk Adjustments
Where a limited-risk tested party is being benchmarked against comparables that, despite passing functional filters, appear to bear materially more market, credit, or inventory risk in substance, a risk adjustment can be applied to bring the comparable set's expected return closer to what a lower-risk entity would command. Risk adjustments are inherently more judgment-intensive than working capital adjustments because risk is harder to quantify from public financial statements alone, and tax authorities scrutinise them more closely as a result, a risk adjustment without clear, quantifiable evidence of the risk differential is one of the more frequently disallowed adjustments in practice.
Cross-GAAP Adjustments
As benchmarking searches increasingly draw comparables from multiple jurisdictions to find an adequate sample size, differences in accounting standards between the tested party's jurisdiction and the comparables' home jurisdictions become a real source of margin distortion. A frequently encountered example is lease accounting: under IFRS 16 and similar standards, operating leases are capitalised onto the balance sheet with a corresponding depreciation and interest expense pattern, while under standards without a mandatory equivalent, lease payments remain a straight operating expense, producing structurally different operating margins for otherwise functionally similar comparables purely as an artefact of which accounting regime they report under, unrelated to any genuine difference in economic performance.
Materiality and the Documentation Standard
Not every difference warrants an adjustment. The OECD Guidelines caution against making adjustments for every conceivable comparability defect, since each adjustment introduces its own layer of estimation error, and a study with numerous small adjustments can end up less reliable than one with a slightly imperfect but unadjusted comparable set. The practical standard is to adjust only for differences that are material, quantifiable with reasonable reliability, and clearly linked to an economic driver of the margin being tested, and to document the adjustment methodology transparently enough that a reviewing tax authority can replicate the calculation.
A Consistent Adjustment Policy Across Years
Tax authorities frequently notice, and query, a group that applies a comparability adjustment in one filing year and abandons it the next without a clear change in underlying facts. Establishing a consistent, documented adjustment policy applied year over year, and revisiting that policy only when the underlying comparability driver genuinely changes, lends considerably more credibility to the benchmarking study than an ad hoc approach chosen fresh each year based on which adjustment happens to produce the most convenient result.
Conclusion
Working capital, risk and cross-GAAP adjustments are only defensible where the underlying comparability defect is material, quantifiable, and consistently applied across filing years, per the materiality standard set out in Chapter III. A benchmarking study that either ignores a material accounting-standard difference, such as IFRS 16 lease capitalisation against a non-mandatory-capitalisation regime, or over-adjusts a comparable set beyond what the evidence supports, fails the same reliability test from opposite directions.
Read More

The Profit Split Method: The Method of Last Resort That's Becoming First Choice
The Profit Split Method: The Method of Last Resort That's Becoming First Choice
For years, the Profit Split Method (PSM) carried a reputation as the method practitioners reached for only when nothing else worked, when comparables were unavailable, when both parties to a transaction made unique and valuable contributions, or when transactions were too integrated to test one side in isolation. That reputation is shifting. As global value chains grow more integrated and intangible-driven, PSM is increasingly the method that best reflects economic reality, particularly in digital, platform, and R&D-intensive businesses where no single entity can meaningfully be treated as the routine, tested party.
When PSM Is the Right Fit
The OECD identifies PSM as most appropriate where both parties to a transaction make unique and valuable contributions, typically unique intangibles, such that a one-sided method testing only one party would fail to capture the value the other party contributes; where the transaction is so highly integrated that it cannot reliably be evaluated on a separate, transaction-by-transaction basis; and where the parties share the assumption of economically significant risks, or separately assume closely related risks, in relation to the same transaction.
Contribution Analysis vs Residual Analysis
PSM can be applied through a contribution analysis, which divides combined profits based on the relative value of each party's functions, assets, and risks, typically requiring some form of external valuation benchmark to anchor the split. More commonly, groups apply a residual analysis in two stages: first, each party is allocated a routine return for its non-unique functions using a one-sided method like TNMM or cost-plus; second, any residual profit remaining after those routine returns is split between the parties based on the relative value of their unique contributions, most often their respective intangibles.
The Splitting Factor Problem
The most contested element of any PSM application is the splitting factor, the metric used to divide the residual profit. Common factors include relative R&D spend, relative marketing spend, headcount of key value-creating personnel, or capitalised intangible development costs. None of these factors is a perfect proxy for value creation, and tax authorities frequently challenge the chosen factor as understating their own jurisdiction's contribution, particularly where a market jurisdiction argues that local sales, marketing, or customer relationships deserve greater weight than a pure R&D-cost-based split would assign them.
PSM and Digital Business Models
The rise of digital and platform business models, where user data, network effects, and platform-side intangibles are jointly created across multiple jurisdictions, has pushed PSM from an exceptional method toward a mainstream one for these sectors. Amount A of Pillar One, though a separate mechanism from traditional bilateral transfer pricing, itself borrows the profit-split logic in reallocating a portion of residual profit to market jurisdictions, reflecting a broader policy convergence toward profit-split thinking wherever integrated value creation resists one-sided testing.
Testing the Result for Reasonableness
Because PSM outcomes depend so heavily on the splitting factor chosen, a prudent practitioner tests the result against alternative splitting factors and against a sanity check of what each party's implied return looks like on a standalone basis. A split that leaves one party earning materially less than a routine return for the functions it performs, despite ostensibly holding unique intangibles, usually signals that the splitting factor has been misapplied rather than that the underlying value creation genuinely favours the other party so heavily.
Conclusion
Under Chapter II, Part III, PSM is appropriate only where unique and valuable contributions exist on both sides of a highly integrated transaction, and its defensibility rests almost entirely on the splitting factor chosen for the residual profit stage. A PSM position should be tested against at least one alternative splitting factor before filing, since the factor, not the method itself, is what a tax authority will contest first.
For years, the Profit Split Method (PSM) carried a reputation as the method practitioners reached for only when nothing else worked, when comparables were unavailable, when both parties to a transaction made unique and valuable contributions, or when transactions were too integrated to test one side in isolation. That reputation is shifting. As global value chains grow more integrated and intangible-driven, PSM is increasingly the method that best reflects economic reality, particularly in digital, platform, and R&D-intensive businesses where no single entity can meaningfully be treated as the routine, tested party.
When PSM Is the Right Fit
The OECD identifies PSM as most appropriate where both parties to a transaction make unique and valuable contributions, typically unique intangibles, such that a one-sided method testing only one party would fail to capture the value the other party contributes; where the transaction is so highly integrated that it cannot reliably be evaluated on a separate, transaction-by-transaction basis; and where the parties share the assumption of economically significant risks, or separately assume closely related risks, in relation to the same transaction.
Contribution Analysis vs Residual Analysis
PSM can be applied through a contribution analysis, which divides combined profits based on the relative value of each party's functions, assets, and risks, typically requiring some form of external valuation benchmark to anchor the split. More commonly, groups apply a residual analysis in two stages: first, each party is allocated a routine return for its non-unique functions using a one-sided method like TNMM or cost-plus; second, any residual profit remaining after those routine returns is split between the parties based on the relative value of their unique contributions, most often their respective intangibles.
The Splitting Factor Problem
The most contested element of any PSM application is the splitting factor, the metric used to divide the residual profit. Common factors include relative R&D spend, relative marketing spend, headcount of key value-creating personnel, or capitalised intangible development costs. None of these factors is a perfect proxy for value creation, and tax authorities frequently challenge the chosen factor as understating their own jurisdiction's contribution, particularly where a market jurisdiction argues that local sales, marketing, or customer relationships deserve greater weight than a pure R&D-cost-based split would assign them.
PSM and Digital Business Models
The rise of digital and platform business models, where user data, network effects, and platform-side intangibles are jointly created across multiple jurisdictions, has pushed PSM from an exceptional method toward a mainstream one for these sectors. Amount A of Pillar One, though a separate mechanism from traditional bilateral transfer pricing, itself borrows the profit-split logic in reallocating a portion of residual profit to market jurisdictions, reflecting a broader policy convergence toward profit-split thinking wherever integrated value creation resists one-sided testing.
Testing the Result for Reasonableness
Because PSM outcomes depend so heavily on the splitting factor chosen, a prudent practitioner tests the result against alternative splitting factors and against a sanity check of what each party's implied return looks like on a standalone basis. A split that leaves one party earning materially less than a routine return for the functions it performs, despite ostensibly holding unique intangibles, usually signals that the splitting factor has been misapplied rather than that the underlying value creation genuinely favours the other party so heavily.
Conclusion
Under Chapter II, Part III, PSM is appropriate only where unique and valuable contributions exist on both sides of a highly integrated transaction, and its defensibility rests almost entirely on the splitting factor chosen for the residual profit stage. A PSM position should be tested against at least one alternative splitting factor before filing, since the factor, not the method itself, is what a tax authority will contest first.
Read More

Low Value-Adding Intra-Group Services: The 5% Safe Harbour Transfer Pricing Officers Still Challenge
Low Value-Adding Intra-Group Services: The 5% Safe Harbour Transfer Pricing Officers Still Challenge
Not every intra-group service is a strategic, high-value contribution deserving of intensive benchmarking. A large share of intercompany service charges, IT helpdesk support, payroll processing, group accounting consolidation, routine HR administration, are what the OECD terms low value-adding intra-group services: support-type activities that are not part of the group's core business, do not involve the use of unique intangibles, and do not create material risk for the service provider. Chapter VII of the OECD Guidelines carves out a simplified approach specifically to reduce the compliance burden of pricing these routine services.
What Qualifies as Low Value-Adding
The OECD's elective simplified approach applies to services that are supportive in nature, not part of the MNE group's core business, do not require unique and valuable intangibles, do not involve significant risk assumption, and are not typically performed in-house by comparable independent enterprises without paying a fee for them. Explicitly excluded from the simplified approach are services central to the group's principal business, R&D services, and financial transactions, these require full functional and comparability analysis in the ordinary way.
The Simplified Cost Pooling and 5% Mark-up
Under the simplified approach, all qualifying low value-adding services provided across the group in a given period are pooled into a single cost base, allocated among recipient entities using a reasonable allocation key (headcount, revenue, or another metric appropriate to the service), and marked up at a flat 5%, without the need for a separate benchmarking study to justify that specific percentage. This significantly reduces documentation burden, since the taxpayer does not need to defend a comparable set for what would otherwise be a large volume of low-materiality intercompany charges.
The Benefit Test Still Applies
Electing the simplified approach does not remove the requirement to demonstrate that the recipient entity genuinely benefited from the service, a persistent area of tax authority challenge, particularly for centralised functions like group-wide market intelligence platforms, shared data infrastructure, or centralised AI development costs, where local entities increasingly push back on whether they received an identifiable economic or commercial benefit distinct from mere shareholder oversight (which is never chargeable). Documentation should still describe the service, the rationale for the allocation key chosen, and evidence the service was actually rendered.
Country-Level Variation in Adoption
While the OECD framework is elective at both the group and the recipient-country level, not every jurisdiction has adopted the simplified approach, and some impose their own local thresholds or documentation requirements even where they do accept the general concept. Groups relying on the 5% safe harbour in a cross-border service arrangement need to confirm bilateral acceptance, since if the recipient jurisdiction has not adopted the simplified approach, the group may need to run a full benchmarking exercise for that leg of the arrangement regardless of what the payer jurisdiction accepts.
Building a Defensible Service Cost Pool
In practice, the strength of a low value-adding services position depends heavily on the quality of the underlying cost pool. Costs directly traceable to a specific service should be identified and allocated using a key genuinely correlated with consumption of that service, rather than a single generic allocation key applied indiscriminately across an entire bundle of unrelated services. Groups that maintain a clear cost-pool schedule, updated annually and reconciled to the general ledger, are far better positioned to defend the allocation than those that reconstruct the pool retrospectively when a query arrives.
Conclusion
The Chapter VII simplified approach removes the need for a comparable-set benchmarking study on qualifying low value-adding services, but it does not remove the benefit test, the requirement that the service be properly classified as low value-adding in the first place, or the requirement for bilateral adoption by the recipient jurisdiction. A 5% mark-up applied to a misclassified service, or applied unilaterally where the counterparty jurisdiction has not adopted the simplified approach, remains exposed to a full benchmarking challenge.
Not every intra-group service is a strategic, high-value contribution deserving of intensive benchmarking. A large share of intercompany service charges, IT helpdesk support, payroll processing, group accounting consolidation, routine HR administration, are what the OECD terms low value-adding intra-group services: support-type activities that are not part of the group's core business, do not involve the use of unique intangibles, and do not create material risk for the service provider. Chapter VII of the OECD Guidelines carves out a simplified approach specifically to reduce the compliance burden of pricing these routine services.
What Qualifies as Low Value-Adding
The OECD's elective simplified approach applies to services that are supportive in nature, not part of the MNE group's core business, do not require unique and valuable intangibles, do not involve significant risk assumption, and are not typically performed in-house by comparable independent enterprises without paying a fee for them. Explicitly excluded from the simplified approach are services central to the group's principal business, R&D services, and financial transactions, these require full functional and comparability analysis in the ordinary way.
The Simplified Cost Pooling and 5% Mark-up
Under the simplified approach, all qualifying low value-adding services provided across the group in a given period are pooled into a single cost base, allocated among recipient entities using a reasonable allocation key (headcount, revenue, or another metric appropriate to the service), and marked up at a flat 5%, without the need for a separate benchmarking study to justify that specific percentage. This significantly reduces documentation burden, since the taxpayer does not need to defend a comparable set for what would otherwise be a large volume of low-materiality intercompany charges.
The Benefit Test Still Applies
Electing the simplified approach does not remove the requirement to demonstrate that the recipient entity genuinely benefited from the service, a persistent area of tax authority challenge, particularly for centralised functions like group-wide market intelligence platforms, shared data infrastructure, or centralised AI development costs, where local entities increasingly push back on whether they received an identifiable economic or commercial benefit distinct from mere shareholder oversight (which is never chargeable). Documentation should still describe the service, the rationale for the allocation key chosen, and evidence the service was actually rendered.
Country-Level Variation in Adoption
While the OECD framework is elective at both the group and the recipient-country level, not every jurisdiction has adopted the simplified approach, and some impose their own local thresholds or documentation requirements even where they do accept the general concept. Groups relying on the 5% safe harbour in a cross-border service arrangement need to confirm bilateral acceptance, since if the recipient jurisdiction has not adopted the simplified approach, the group may need to run a full benchmarking exercise for that leg of the arrangement regardless of what the payer jurisdiction accepts.
Building a Defensible Service Cost Pool
In practice, the strength of a low value-adding services position depends heavily on the quality of the underlying cost pool. Costs directly traceable to a specific service should be identified and allocated using a key genuinely correlated with consumption of that service, rather than a single generic allocation key applied indiscriminately across an entire bundle of unrelated services. Groups that maintain a clear cost-pool schedule, updated annually and reconciled to the general ledger, are far better positioned to defend the allocation than those that reconstruct the pool retrospectively when a query arrives.
Conclusion
The Chapter VII simplified approach removes the need for a comparable-set benchmarking study on qualifying low value-adding services, but it does not remove the benefit test, the requirement that the service be properly classified as low value-adding in the first place, or the requirement for bilateral adoption by the recipient jurisdiction. A 5% mark-up applied to a misclassified service, or applied unilaterally where the counterparty jurisdiction has not adopted the simplified approach, remains exposed to a full benchmarking challenge.
Read More

Functional Characterisation: The Transfer Pricing Question Tax Authorities Test Before They Test Your Margin
Functional Characterisation: The Transfer Pricing Question Tax Authorities Test Before They Test Your Margin
Before any benchmarking study begins, transfer pricing analysis depends on correctly characterising what an entity actually is, a decision that determines which comparable set is relevant, which method applies, and what margin range is defensible. Distributors are the classic battleground for this question, sitting on a spectrum that runs from full-fledged distributor to limited-risk distributor to commissionaire, with real commercial and tax consequences attached to where an entity actually sits.
The Spectrum, Defined by Function and Risk
A full-fledged distributor (FFD) takes title to inventory, bears market and credit risk, invests in its own marketing and brand-building, and typically carries meaningful working capital and inventory risk, commanding a correspondingly higher expected return. A limited-risk distributor (LRD) also takes title to goods but operates under group-set pricing policies, carries minimal inventory and credit risk (often supported by buy-back guarantees or centrally negotiated terms), and is compensated with a lower, more stable margin reflecting its reduced risk profile. A commissionaire or sales agent never takes title at all, earns a commission on sales it facilitates, and bears essentially no market risk.
Why the Classification Is Contested So Often
The characterisation is rarely a clean fit to a textbook category. An entity may formally be structured as an LRD in its intercompany agreement while, in actual conduct, negotiating with local customers, holding meaningful inventory for extended periods, or bearing bad-debt risk the contract nominally assigns elsewhere. Tax authorities increasingly test contractual characterisation against actual conduct, the OECD's delineation-of-transaction guidance under Chapter I explicitly instructs that where conduct diverges from contract, conduct governs. This is the single most common ground on which distributor benchmarking studies are challenged.
The FAR Questionnaire as the Evidentiary Backbone
A defensible characterisation rests on a detailed Functions, Assets and Risks (FAR) questionnaire completed with the actual local management team, cross-checked against organisational charts, inventory ageing reports, credit policies, and marketing spend records, not just the intercompany agreement's stated allocation of risk. Where a distributor's actual conduct shows it bearing meaningful market or credit risk despite a contract that assigns that risk to the principal, the benchmarking study needs to reflect the higher-risk characterisation, or it will not withstand a functional audit.
Consequences of Getting It Wrong
Misclassifying a full-fledged distributor as a limited-risk distributor, or the reverse, leads to selecting the wrong comparable set entirely, since limited-risk comparables typically show tighter, lower-margin ranges than full-fledged comparables, producing an arm's length range that bears no genuine relationship to the entity actually being tested. Reclassification disputes are also a frequent trigger for retrospective TP adjustments spanning multiple years, since the characterisation question, once challenged, tends to apply to the entire period the underlying business model was in place.
Reviewing Characterisation as the Business Evolves
A distributor's functional profile is rarely static. As a subsidiary grows, it may begin absorbing local marketing decisions, negotiating directly with key accounts, or carrying larger safety-stock inventories to meet local service expectations, gradually drifting toward a higher-risk profile than its original intercompany agreement describes. Groups should treat functional characterisation as something to be revisited periodically as the business matures, rather than a determination made once at entity formation and left unexamined for years afterward.
Conclusion
Chapter I's delineation-of-transaction guidance is explicit that actual conduct governs over contractual allocation of risk, which makes the FAR questionnaire, not the intercompany distribution agreement, the primary evidence in any functional characterisation dispute. An LRD, FFD or commissionaire classification is only as reliable as the FAR evidence supporting it, and that evidence needs revisiting whenever the entity's actual conduct in the market shifts.
Before any benchmarking study begins, transfer pricing analysis depends on correctly characterising what an entity actually is, a decision that determines which comparable set is relevant, which method applies, and what margin range is defensible. Distributors are the classic battleground for this question, sitting on a spectrum that runs from full-fledged distributor to limited-risk distributor to commissionaire, with real commercial and tax consequences attached to where an entity actually sits.
The Spectrum, Defined by Function and Risk
A full-fledged distributor (FFD) takes title to inventory, bears market and credit risk, invests in its own marketing and brand-building, and typically carries meaningful working capital and inventory risk, commanding a correspondingly higher expected return. A limited-risk distributor (LRD) also takes title to goods but operates under group-set pricing policies, carries minimal inventory and credit risk (often supported by buy-back guarantees or centrally negotiated terms), and is compensated with a lower, more stable margin reflecting its reduced risk profile. A commissionaire or sales agent never takes title at all, earns a commission on sales it facilitates, and bears essentially no market risk.
Why the Classification Is Contested So Often
The characterisation is rarely a clean fit to a textbook category. An entity may formally be structured as an LRD in its intercompany agreement while, in actual conduct, negotiating with local customers, holding meaningful inventory for extended periods, or bearing bad-debt risk the contract nominally assigns elsewhere. Tax authorities increasingly test contractual characterisation against actual conduct, the OECD's delineation-of-transaction guidance under Chapter I explicitly instructs that where conduct diverges from contract, conduct governs. This is the single most common ground on which distributor benchmarking studies are challenged.
The FAR Questionnaire as the Evidentiary Backbone
A defensible characterisation rests on a detailed Functions, Assets and Risks (FAR) questionnaire completed with the actual local management team, cross-checked against organisational charts, inventory ageing reports, credit policies, and marketing spend records, not just the intercompany agreement's stated allocation of risk. Where a distributor's actual conduct shows it bearing meaningful market or credit risk despite a contract that assigns that risk to the principal, the benchmarking study needs to reflect the higher-risk characterisation, or it will not withstand a functional audit.
Consequences of Getting It Wrong
Misclassifying a full-fledged distributor as a limited-risk distributor, or the reverse, leads to selecting the wrong comparable set entirely, since limited-risk comparables typically show tighter, lower-margin ranges than full-fledged comparables, producing an arm's length range that bears no genuine relationship to the entity actually being tested. Reclassification disputes are also a frequent trigger for retrospective TP adjustments spanning multiple years, since the characterisation question, once challenged, tends to apply to the entire period the underlying business model was in place.
Reviewing Characterisation as the Business Evolves
A distributor's functional profile is rarely static. As a subsidiary grows, it may begin absorbing local marketing decisions, negotiating directly with key accounts, or carrying larger safety-stock inventories to meet local service expectations, gradually drifting toward a higher-risk profile than its original intercompany agreement describes. Groups should treat functional characterisation as something to be revisited periodically as the business matures, rather than a determination made once at entity formation and left unexamined for years afterward.
Conclusion
Chapter I's delineation-of-transaction guidance is explicit that actual conduct governs over contractual allocation of risk, which makes the FAR questionnaire, not the intercompany distribution agreement, the primary evidence in any functional characterisation dispute. An LRD, FFD or commissionaire classification is only as reliable as the FAR evidence supporting it, and that evidence needs revisiting whenever the entity's actual conduct in the market shifts.
Read More

Secondary Adjustments: When a Primary TP Adjustment Creates a Second Tax Problem
Secondary Adjustments: When a Primary TP Adjustment Creates a Second Tax Problem
A primary transfer pricing adjustment restates the taxable income of an entity to reflect the arm's length price. But restating income on paper does not, by itself, move any actual money between the entities involved. If the group's controlled transaction was priced below arm's length, the additional profit implied by the adjustment sits, in economic substance, with the counterparty that received the underpriced goods or services, not with the entity now reporting the higher income. Secondary adjustments exist to resolve this mismatch between the tax accounts and the actual flow of funds.
The Deemed Dividend and Deemed Loan Mechanisms
Two mechanisms dominate secondary adjustment practice. Under the deemed dividend approach, the excess amount is treated as if it had been distributed as a dividend from the entity that retained the economic benefit to its parent or shareholder, potentially triggering dividend withholding tax. Under the deemed loan approach, the mechanism India adopted under Section 92CE of the Income-tax Act, the excess amount is treated as a loan from the adjusted entity to its associated enterprise, with notional interest imputed on the outstanding balance until it is actually repatriated.
Why Secondary Adjustments Matter More Than They Appear To
Secondary adjustments can compound the cost of a primary adjustment substantially. A primary adjustment increases taxable income once; a secondary adjustment can trigger recurring notional interest income (or withholding tax) year after year until the underlying cash is actually repatriated to the jurisdiction that made the adjustment. Groups that treat a primary TP adjustment as a one-time cost frequently underestimate the ongoing exposure created by an unaddressed secondary adjustment.
Repatriation as the Escape Route
Most regimes that impose secondary adjustments, including India's, allow the notional interest exposure to be extinguished by actually repatriating the excess money into the jurisdiction within a prescribed timeframe following the primary adjustment. This makes the practical response to a primary TP adjustment as much a treasury and FEMA/exchange-control question as a tax question, repatriation needs to be executed correctly under the applicable capital account regulations, not just accounted for on paper.
Double Taxation Risk
Because not all jurisdictions recognise secondary adjustments or provide symmetrical relief, and because a deemed dividend or deemed loan may not be honoured by the counterparty jurisdiction as a genuine transaction, secondary adjustments carry a meaningful risk of double taxation that is harder to resolve through a Mutual Agreement Procedure than the primary adjustment itself, since MAP relief is generally framed around the primary income allocation rather than the deemed distribution or loan.
Building Secondary Adjustments into TP Risk Management
Groups that model TP audit exposure typically stop at the primary adjustment, quantifying the additional tax on restated income and treating that as the full cost of a potential dispute. A more complete risk model layers in the secondary adjustment mechanism applicable in the relevant jurisdiction, the notional interest rate likely to be applied, and a realistic repatriation timeline, so that the true worst-case exposure, not just the headline primary figure, informs how aggressively a group is willing to defend a given pricing position.
Conclusion
A primary adjustment under Section 92C, or its equivalent elsewhere, only restates taxable income; it does not move the underlying cash. Wherever a secondary adjustment regime applies, such as the deemed loan mechanism under Section 92CE, the notional interest exposure and the repatriation deadline need to be modelled as part of the same transfer pricing risk assessment as the primary adjustment itself, not as a separate, later compliance step.
A primary transfer pricing adjustment restates the taxable income of an entity to reflect the arm's length price. But restating income on paper does not, by itself, move any actual money between the entities involved. If the group's controlled transaction was priced below arm's length, the additional profit implied by the adjustment sits, in economic substance, with the counterparty that received the underpriced goods or services, not with the entity now reporting the higher income. Secondary adjustments exist to resolve this mismatch between the tax accounts and the actual flow of funds.
The Deemed Dividend and Deemed Loan Mechanisms
Two mechanisms dominate secondary adjustment practice. Under the deemed dividend approach, the excess amount is treated as if it had been distributed as a dividend from the entity that retained the economic benefit to its parent or shareholder, potentially triggering dividend withholding tax. Under the deemed loan approach, the mechanism India adopted under Section 92CE of the Income-tax Act, the excess amount is treated as a loan from the adjusted entity to its associated enterprise, with notional interest imputed on the outstanding balance until it is actually repatriated.
Why Secondary Adjustments Matter More Than They Appear To
Secondary adjustments can compound the cost of a primary adjustment substantially. A primary adjustment increases taxable income once; a secondary adjustment can trigger recurring notional interest income (or withholding tax) year after year until the underlying cash is actually repatriated to the jurisdiction that made the adjustment. Groups that treat a primary TP adjustment as a one-time cost frequently underestimate the ongoing exposure created by an unaddressed secondary adjustment.
Repatriation as the Escape Route
Most regimes that impose secondary adjustments, including India's, allow the notional interest exposure to be extinguished by actually repatriating the excess money into the jurisdiction within a prescribed timeframe following the primary adjustment. This makes the practical response to a primary TP adjustment as much a treasury and FEMA/exchange-control question as a tax question, repatriation needs to be executed correctly under the applicable capital account regulations, not just accounted for on paper.
Double Taxation Risk
Because not all jurisdictions recognise secondary adjustments or provide symmetrical relief, and because a deemed dividend or deemed loan may not be honoured by the counterparty jurisdiction as a genuine transaction, secondary adjustments carry a meaningful risk of double taxation that is harder to resolve through a Mutual Agreement Procedure than the primary adjustment itself, since MAP relief is generally framed around the primary income allocation rather than the deemed distribution or loan.
Building Secondary Adjustments into TP Risk Management
Groups that model TP audit exposure typically stop at the primary adjustment, quantifying the additional tax on restated income and treating that as the full cost of a potential dispute. A more complete risk model layers in the secondary adjustment mechanism applicable in the relevant jurisdiction, the notional interest rate likely to be applied, and a realistic repatriation timeline, so that the true worst-case exposure, not just the headline primary figure, informs how aggressively a group is willing to defend a given pricing position.
Conclusion
A primary adjustment under Section 92C, or its equivalent elsewhere, only restates taxable income; it does not move the underlying cash. Wherever a secondary adjustment regime applies, such as the deemed loan mechanism under Section 92CE, the notional interest exposure and the repatriation deadline need to be modelled as part of the same transfer pricing risk assessment as the primary adjustment itself, not as a separate, later compliance step.
Read More

Intra-Group Loans and Credit Rating Notching: Getting the Interest Rate Defensible
Intra-Group Loans and Credit Rating Notching: Getting the Interest Rate Defensible
Every intercompany loan raises the same underlying question: what interest rate would this borrower have obtained from an independent lender, on these terms, at this point in time? Answering it requires more than pulling a benchmark yield curve. It requires establishing a standalone credit rating for the borrowing entity, because the loan's arm's length pricing hinges entirely on the risk profile the market would have assigned to it absent group membership.
Why the Group Rating Isn't the Borrower's Rating
Multinational groups typically carry a consolidated or parent credit rating that reflects the strength of the group as a whole. Applying that rating directly to a subsidiary's standalone borrowing overstates the subsidiary's true creditworthiness unless a guarantee or comparable explicit support genuinely exists. Rating agencies and TP practitioners instead derive a standalone rating for the borrowing entity based on its own financial ratios, industry position, and country risk, then apply notching adjustments to reflect the degree of implicit support it would realistically receive without a formal guarantee.
Building the Notched Rating
The notching exercise typically starts from the parent or group rating and works downward, applying discrete notch reductions for factors such as the subsidiary's strategic importance to the group, the degree of operational and financial integration, the jurisdiction's country risk ceiling, and the absence of any explicit guarantee or letter of comfort. The resulting standalone rating, often several notches below the parent, becomes the anchor for identifying comparable third-party debt instruments.
Selecting the Right Comparables
Once a standalone rating is established, comparable loan or bond pricing is sourced by matching tenor, currency, seniority, security, and covenant package as closely as possible. Loan-level databases are generally preferred over bond databases because bonds are typically issued by larger, more liquid issuers with different risk and liquidity premia than a typical intercompany loan. Where the loan terms include unusual features, bullet repayment, subordination, or an unusually long tenor, additional adjustments are needed to isolate the effect of those features from the base credit spread.
Cross-Border Complications
For loans between entities in different countries, the analysis must also account for currency risk, sovereign ceiling constraints on the borrower's rating, and, increasingly, the borrower jurisdiction's own thin capitalisation and interest deductibility limitations, which can cap the deductible interest independently of whether the rate itself is arm's length. A rate that is defensible under transfer pricing rules can still be partially disallowed under a separate interest limitation regime, so both analyses need to be run together rather than in isolation.
Tenor, Bullet Structures, and Other Term-Specific Adjustments
Intercompany loans frequently carry features that are less common in the third-party debt markets used for benchmarking, such as long fixed tenors, bullet repayment at maturity rather than amortising instalments, or subordination to other group debt. Each of these features shifts the risk profile relative to a plain-vanilla comparable, and a benchmarking study that borrows a comparable's coupon without adjusting for tenor and repayment structure differences understates the true comparability gap between the instruments being compared.
Conclusion
Chapter X makes the standalone credit rating, not the group rating, the anchor for intercompany loan pricing, and the notching analysis is the evidentiary bridge between the two. A loan rate benchmarked without a documented notched rating, matched to comparable tenor, seniority and repayment structure, does not satisfy the delineation and comparability requirements Chapter X sets out, regardless of how closely the headline rate tracks a generic yield curve.
Every intercompany loan raises the same underlying question: what interest rate would this borrower have obtained from an independent lender, on these terms, at this point in time? Answering it requires more than pulling a benchmark yield curve. It requires establishing a standalone credit rating for the borrowing entity, because the loan's arm's length pricing hinges entirely on the risk profile the market would have assigned to it absent group membership.
Why the Group Rating Isn't the Borrower's Rating
Multinational groups typically carry a consolidated or parent credit rating that reflects the strength of the group as a whole. Applying that rating directly to a subsidiary's standalone borrowing overstates the subsidiary's true creditworthiness unless a guarantee or comparable explicit support genuinely exists. Rating agencies and TP practitioners instead derive a standalone rating for the borrowing entity based on its own financial ratios, industry position, and country risk, then apply notching adjustments to reflect the degree of implicit support it would realistically receive without a formal guarantee.
Building the Notched Rating
The notching exercise typically starts from the parent or group rating and works downward, applying discrete notch reductions for factors such as the subsidiary's strategic importance to the group, the degree of operational and financial integration, the jurisdiction's country risk ceiling, and the absence of any explicit guarantee or letter of comfort. The resulting standalone rating, often several notches below the parent, becomes the anchor for identifying comparable third-party debt instruments.
Selecting the Right Comparables
Once a standalone rating is established, comparable loan or bond pricing is sourced by matching tenor, currency, seniority, security, and covenant package as closely as possible. Loan-level databases are generally preferred over bond databases because bonds are typically issued by larger, more liquid issuers with different risk and liquidity premia than a typical intercompany loan. Where the loan terms include unusual features, bullet repayment, subordination, or an unusually long tenor, additional adjustments are needed to isolate the effect of those features from the base credit spread.
Cross-Border Complications
For loans between entities in different countries, the analysis must also account for currency risk, sovereign ceiling constraints on the borrower's rating, and, increasingly, the borrower jurisdiction's own thin capitalisation and interest deductibility limitations, which can cap the deductible interest independently of whether the rate itself is arm's length. A rate that is defensible under transfer pricing rules can still be partially disallowed under a separate interest limitation regime, so both analyses need to be run together rather than in isolation.
Tenor, Bullet Structures, and Other Term-Specific Adjustments
Intercompany loans frequently carry features that are less common in the third-party debt markets used for benchmarking, such as long fixed tenors, bullet repayment at maturity rather than amortising instalments, or subordination to other group debt. Each of these features shifts the risk profile relative to a plain-vanilla comparable, and a benchmarking study that borrows a comparable's coupon without adjusting for tenor and repayment structure differences understates the true comparability gap between the instruments being compared.
Conclusion
Chapter X makes the standalone credit rating, not the group rating, the anchor for intercompany loan pricing, and the notching analysis is the evidentiary bridge between the two. A loan rate benchmarked without a documented notched rating, matched to comparable tenor, seniority and repayment structure, does not satisfy the delineation and comparability requirements Chapter X sets out, regardless of how closely the headline rate tracks a generic yield curve.
Read More

Location Savings and Location-Specific Advantages: Why a Cost Advantage Is Never Just a Cost Advantage in Transfer Pricing
Location Savings and Location-Specific Advantages: Why a Cost Advantage Is Never Just a Cost Advantage in Transfer Pricing
When a multinational relocates manufacturing, back-office, or R&D functions to a lower-cost jurisdiction, it typically realises meaningful cost savings, cheaper labour, lower rent, favourable input costs. The transfer pricing question this raises is deceptively simple to state and genuinely difficult to resolve: do those savings belong to the group entity that relocated, or should some portion be shared with the local entity, the local market, or even priced into the transaction with independent customers?
Location Savings vs Location-Specific Advantages
The OECD distinguishes between location savings, net cost reductions from operating in a particular location, such as lower wages, and broader location-specific advantages (LSAs), which include factors like access to a large consumer market, a skilled labour pool, or agglomeration benefits from industry clusters. LSAs are harder to quantify because they are not simply a cost differential; they can also enhance revenue or market position in ways that go beyond the cost side of the ledger.
The Allocation Question
Where location savings exist, the OECD Guidelines indicate that whether and how much of the saving should be allocated to the local entity depends on what independent parties would have agreed under comparable circumstances, which in turn depends on factors like the competitive intensity of the local market, whether the savings are passed through to customers via pricing pressure, and the bargaining power of the local operation relative to the rest of the group. In highly competitive local markets, market forces may erode most of the saving through pricing pressure regardless of TP policy; in less competitive markets, the group may retain more of the benefit.
India and China: The Jurisdictions That Pushed This Issue
India and China have historically taken assertive positions that a meaningful share of location savings realised through captive service centres and manufacturing operations should be retained locally, arguing that comparables drawn from developed-market service providers understate the value created by operating in a high-growth, cost-advantaged jurisdiction. This has driven demand for India-specific and China-specific comparable sets and has been a recurring source of dispute for captive IT/ITES and R&D centres benchmarked against global comparables.
Practical Implications for Captive Structures
Groups operating captive centres in cost-advantaged jurisdictions should proactively assess whether their remuneration model, typically cost-plus, adequately reflects any bargained-for share of location savings, rather than assuming a standard markup insulates the arrangement from challenge. Where the local entity performs functions that are strategically important, not merely cost-driven, a pure cost-plus model detached from any location-saving allocation is increasingly vulnerable to audit adjustment in jurisdictions that have signalled this as a priority area.
Evidencing the Counterfactual
Any claim that location savings should, or should not, be shared with the local entity ultimately rests on a counterfactual: what would an independent local operation have negotiated in its place. Building that counterfactual credibly requires evidence of local market competitiveness, the bargaining leverage the local entity would realistically have held as a standalone business, and, where available, third party benchmarks of comparable arrangements in similarly cost-advantaged markets, rather than an assertion that no sharing was commercially warranted.
Conclusion
Location savings are not addressed by a discrete OECD method; they are a comparability factor under Chapter I that can distort a benchmarking study's reliability wherever the tested party operates in a materially lower-cost jurisdiction than its comparable set. Where a jurisdiction, India and China chief among them, has signalled that local retention of location savings is expected, the benchmarking study should build that allocation into the tested margin rather than leaving it to be litigated after a transfer pricing officer raises it.
When a multinational relocates manufacturing, back-office, or R&D functions to a lower-cost jurisdiction, it typically realises meaningful cost savings, cheaper labour, lower rent, favourable input costs. The transfer pricing question this raises is deceptively simple to state and genuinely difficult to resolve: do those savings belong to the group entity that relocated, or should some portion be shared with the local entity, the local market, or even priced into the transaction with independent customers?
Location Savings vs Location-Specific Advantages
The OECD distinguishes between location savings, net cost reductions from operating in a particular location, such as lower wages, and broader location-specific advantages (LSAs), which include factors like access to a large consumer market, a skilled labour pool, or agglomeration benefits from industry clusters. LSAs are harder to quantify because they are not simply a cost differential; they can also enhance revenue or market position in ways that go beyond the cost side of the ledger.
The Allocation Question
Where location savings exist, the OECD Guidelines indicate that whether and how much of the saving should be allocated to the local entity depends on what independent parties would have agreed under comparable circumstances, which in turn depends on factors like the competitive intensity of the local market, whether the savings are passed through to customers via pricing pressure, and the bargaining power of the local operation relative to the rest of the group. In highly competitive local markets, market forces may erode most of the saving through pricing pressure regardless of TP policy; in less competitive markets, the group may retain more of the benefit.
India and China: The Jurisdictions That Pushed This Issue
India and China have historically taken assertive positions that a meaningful share of location savings realised through captive service centres and manufacturing operations should be retained locally, arguing that comparables drawn from developed-market service providers understate the value created by operating in a high-growth, cost-advantaged jurisdiction. This has driven demand for India-specific and China-specific comparable sets and has been a recurring source of dispute for captive IT/ITES and R&D centres benchmarked against global comparables.
Practical Implications for Captive Structures
Groups operating captive centres in cost-advantaged jurisdictions should proactively assess whether their remuneration model, typically cost-plus, adequately reflects any bargained-for share of location savings, rather than assuming a standard markup insulates the arrangement from challenge. Where the local entity performs functions that are strategically important, not merely cost-driven, a pure cost-plus model detached from any location-saving allocation is increasingly vulnerable to audit adjustment in jurisdictions that have signalled this as a priority area.
Evidencing the Counterfactual
Any claim that location savings should, or should not, be shared with the local entity ultimately rests on a counterfactual: what would an independent local operation have negotiated in its place. Building that counterfactual credibly requires evidence of local market competitiveness, the bargaining leverage the local entity would realistically have held as a standalone business, and, where available, third party benchmarks of comparable arrangements in similarly cost-advantaged markets, rather than an assertion that no sharing was commercially warranted.
Conclusion
Location savings are not addressed by a discrete OECD method; they are a comparability factor under Chapter I that can distort a benchmarking study's reliability wherever the tested party operates in a materially lower-cost jurisdiction than its comparable set. Where a jurisdiction, India and China chief among them, has signalled that local retention of location savings is expected, the benchmarking study should build that allocation into the tested margin rather than leaving it to be litigated after a transfer pricing officer raises it.
Read More

Corporate Guarantee Pricing: From the Yield Approach to CDS Spreads
Corporate Guarantee Pricing: From the Yield Approach to CDS Spreads
When a parent company guarantees a subsidiary's third-party borrowing, the subsidiary typically secures a lower interest rate than it would have obtained on a standalone basis, because the lender's credit risk is reduced. That reduction in borrowing cost is a real economic benefit, and the arm's length principle requires that the guarantor be compensated for providing it. The question that generates the most transfer pricing controversy in this space is not whether a guarantee fee is payable, but how much it should be, and several competing methodologies routinely produce very different answers for the same transaction.
The Yield Approach
The most commonly used and most intuitive method compares the interest rate the borrower would pay without the guarantee (based on its own standalone credit rating) against the rate it actually pays with the guarantee in place. The difference, the yield spread, represents the benefit conferred by the guarantee, and the guarantee fee is set as some portion of that spread, reflecting that the benefit should be shared between guarantor and borrower rather than captured entirely by one side.
The Cost Approach and Expected Loss Method
An alternative approach prices the guarantee based on the guarantor's expected cost of providing it, essentially, the expected loss the guarantor bears from the probability of default multiplied by the loss given default, similar to how a commercial guarantor or insurer would price risk. This method draws on option-pricing and credit-risk modelling techniques and is often used where reliable market-based comparables for the yield approach are unavailable.
The CDS Spread Approach
Where a comparable Credit Default Swap exists for the guarantor's or a similarly rated entity's debt, the CDS spread can be used as a market-observed proxy for the cost of credit protection, and by extension, for the arm's length guarantee fee. This approach has gained traction because CDS spreads are transparent and update in real time, but its reliability depends heavily on finding a genuinely comparable reference entity, tenor, and seniority, a challenge that mirrors the comparability demands of the CUP method more broadly.
Implicit Support and the Group Benefit Question
A persistent controversy is the extent to which a subsidiary already benefits from implicit group support, meaning the market's assumption that a parent would not allow a subsidiary to default, even absent a formal guarantee. Several jurisdictions, drawing on cases in this area, hold that only the incremental benefit above and beyond implicit support should be compensated, meaning the guarantee fee should be based on the credit rating uplift attributable specifically to the explicit guarantee, not the full gap between standalone and group ratings.
Guarantee Fee Documentation in Practice
A robust guarantee pricing file typically presents the standalone rating derivation for the borrower, a clearly reasoned notching adjustment to arrive at the implicitly supported rating, and a final incremental adjustment isolating the explicit guarantee's contribution before applying the yield spread, cost approach, or CDS benchmark. Where more than one methodology produces materially different results, the practitioner should be prepared to explain the divergence rather than silently selecting whichever number is most favourable, since tax authorities increasingly expect a reconciliation across methods as standard practice for material guarantee arrangements.
Conclusion
Guarantee fee benchmarking should present the yield-spread approach, the expected-loss or cost approach and, where a comparable CDS exists, the market-spread approach side by side, with the final fee isolating only the incremental rating uplift attributable to the explicit guarantee, net of implicit group support. A single-method guarantee fee, unsupported by a rating notching analysis, is one of the most frequently adjusted positions in financial transaction transfer pricing audits.
When a parent company guarantees a subsidiary's third-party borrowing, the subsidiary typically secures a lower interest rate than it would have obtained on a standalone basis, because the lender's credit risk is reduced. That reduction in borrowing cost is a real economic benefit, and the arm's length principle requires that the guarantor be compensated for providing it. The question that generates the most transfer pricing controversy in this space is not whether a guarantee fee is payable, but how much it should be, and several competing methodologies routinely produce very different answers for the same transaction.
The Yield Approach
The most commonly used and most intuitive method compares the interest rate the borrower would pay without the guarantee (based on its own standalone credit rating) against the rate it actually pays with the guarantee in place. The difference, the yield spread, represents the benefit conferred by the guarantee, and the guarantee fee is set as some portion of that spread, reflecting that the benefit should be shared between guarantor and borrower rather than captured entirely by one side.
The Cost Approach and Expected Loss Method
An alternative approach prices the guarantee based on the guarantor's expected cost of providing it, essentially, the expected loss the guarantor bears from the probability of default multiplied by the loss given default, similar to how a commercial guarantor or insurer would price risk. This method draws on option-pricing and credit-risk modelling techniques and is often used where reliable market-based comparables for the yield approach are unavailable.
The CDS Spread Approach
Where a comparable Credit Default Swap exists for the guarantor's or a similarly rated entity's debt, the CDS spread can be used as a market-observed proxy for the cost of credit protection, and by extension, for the arm's length guarantee fee. This approach has gained traction because CDS spreads are transparent and update in real time, but its reliability depends heavily on finding a genuinely comparable reference entity, tenor, and seniority, a challenge that mirrors the comparability demands of the CUP method more broadly.
Implicit Support and the Group Benefit Question
A persistent controversy is the extent to which a subsidiary already benefits from implicit group support, meaning the market's assumption that a parent would not allow a subsidiary to default, even absent a formal guarantee. Several jurisdictions, drawing on cases in this area, hold that only the incremental benefit above and beyond implicit support should be compensated, meaning the guarantee fee should be based on the credit rating uplift attributable specifically to the explicit guarantee, not the full gap between standalone and group ratings.
Guarantee Fee Documentation in Practice
A robust guarantee pricing file typically presents the standalone rating derivation for the borrower, a clearly reasoned notching adjustment to arrive at the implicitly supported rating, and a final incremental adjustment isolating the explicit guarantee's contribution before applying the yield spread, cost approach, or CDS benchmark. Where more than one methodology produces materially different results, the practitioner should be prepared to explain the divergence rather than silently selecting whichever number is most favourable, since tax authorities increasingly expect a reconciliation across methods as standard practice for material guarantee arrangements.
Conclusion
Guarantee fee benchmarking should present the yield-spread approach, the expected-loss or cost approach and, where a comparable CDS exists, the market-spread approach side by side, with the final fee isolating only the incremental rating uplift attributable to the explicit guarantee, net of implicit group support. A single-method guarantee fee, unsupported by a rating notching analysis, is one of the most frequently adjusted positions in financial transaction transfer pricing audits.
Read More
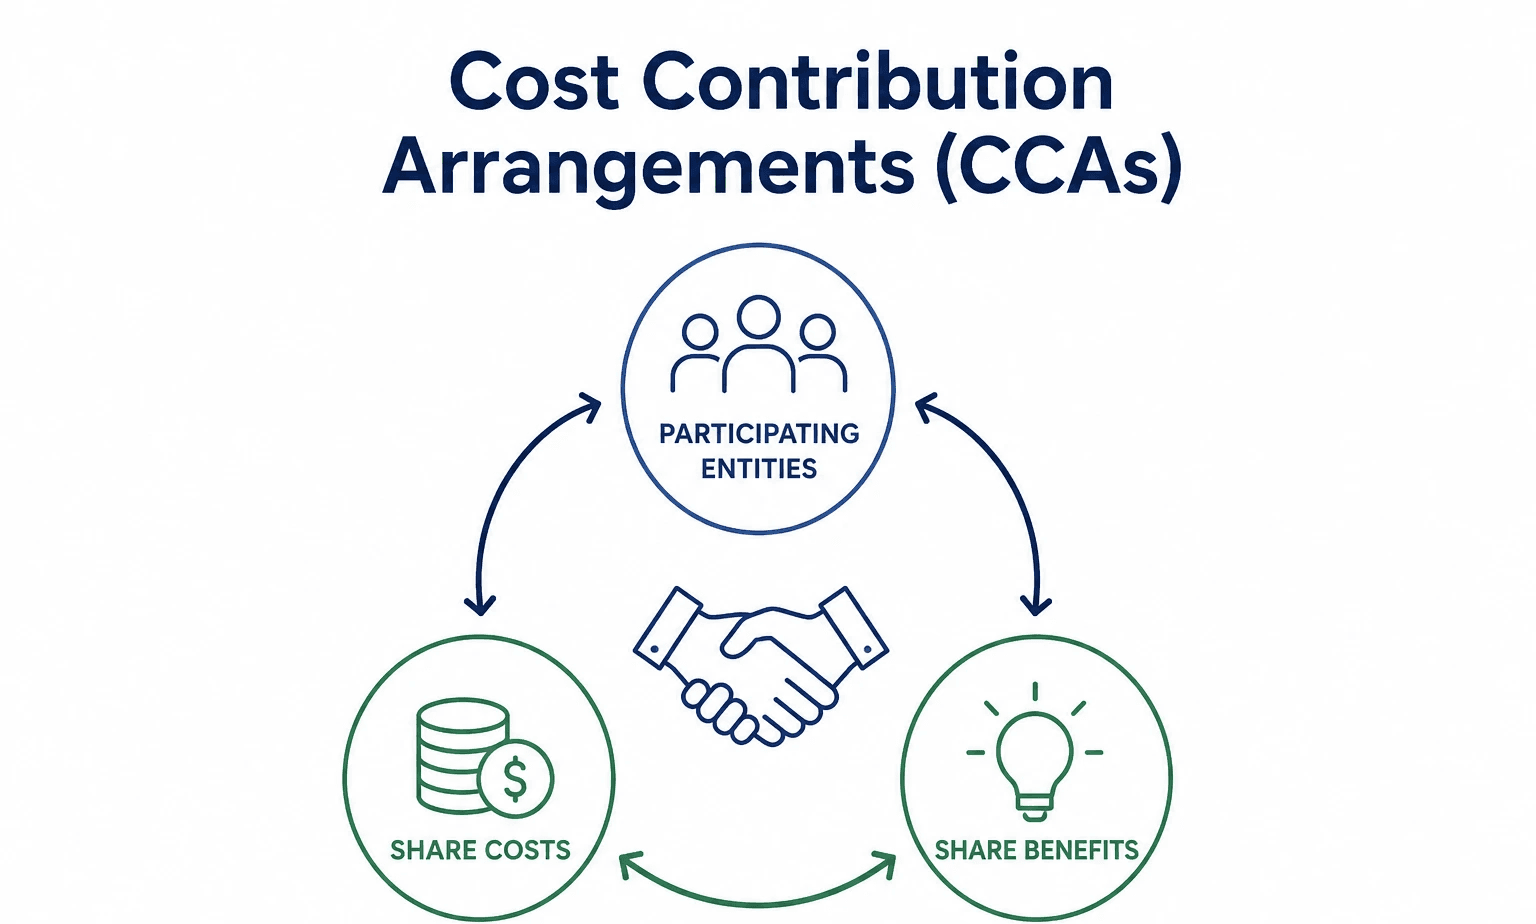
Cost Contribution Arrangements: Structuring Buy-ins, Balancing Payments and Exit Compensation
Cost Contribution Arrangements: Structuring Buy-ins, Balancing Payments and Exit Compensation
Cost Contribution Arrangements (CCAs) allow group entities to jointly fund the development of an intangible, a service, or another benefit, sharing costs in proportion to their expected benefit rather than paying a royalty or service fee after the fact. Common in R&D-heavy industries such as pharmaceuticals and technology, CCAs are attractive because they align cost-bearing with value creation from the outset. They are also, in the OECD's own words, one of the most audited arrangements in transfer pricing, precisely because getting the mechanics wrong can look indistinguishable from profit shifting.
The Core Design Question: Proportionate Contribution
Under Chapter VIII of the OECD Guidelines, each participant's contribution must be proportionate to its share of the overall expected benefits from the CCA activity, not to an arbitrary allocation key chosen for convenience. Benefit shares are typically projected using metrics such as anticipated sales, units expected to be sold or used, or operating expense ratios, whichever most reliably reflects the actual expected benefit. Because these are forward-looking estimates, CCAs require periodic testing against actual outcomes, and a persistent divergence between projected and actual benefit shares is itself a red flag for tax authorities.
Buy-in and Buy-out Payments
When a new participant joins a CCA, it must generally make a buy-in payment reflecting the value of existing contributions it is now entitled to exploit, effectively buying into pre-existing intangibles or capabilities the CCA has already generated. Conversely, when a participant exits, it is typically entitled to a buy-out payment from the remaining participants for the value of the interest it is relinquishing. Both events require a defensible valuation, and both are common flashpoints in disputes because valuing an unfinished R&D pipeline or a partially developed platform is inherently uncertain.
Balancing Payments
Where actual contributions diverge from proportionate benefit shares in a given period, balancing payments true up the arrangement, participants who contributed less than their benefit share compensate those who contributed more. Without a mechanism to make and document balancing payments, a CCA can silently drift into an arrangement where one entity is effectively subsidising the R&D of another, which tax authorities will recharacterise as a disguised service or financing transaction.
Documentation Expectations
A defensible CCA file should include the identity of participants and their respective interests, the scope of activity covered, the expected duration, procedures for admission, withdrawal and termination, the benefit-share methodology and underlying projections, and evidence that contributions were actually made in the form and amount described. Contemporaneous documentation is essential; retrofitting a CCA narrative after a benefit-share dispute arises rarely survives audit.
Governance as a Practical Safeguard
Beyond the technical mechanics, CCAs work best when governed by a standing committee with representatives from each participant, meeting at a set cadence to review benefit-share projections against actual outcomes, approve new admissions and withdrawals, and formally record any balancing payment required for the period. Groups that treat the CCA as a static legal document signed once and revisited only at audit time are far more exposed than those that treat it as a living governance process reviewed annually alongside the group's broader financial planning cycle.
Conclusion
A CCA is tested against Chapter VIII on three specific points: whether contributions are proportionate to projected benefit shares, whether buy-in and buy-out payments reflect the value of pre-existing and relinquished contributions, and whether balancing payments have actually been made where projected and actual benefit shares diverged. A CCA file that cannot evidence all three, contemporaneously, is functionally indistinguishable from an unpriced cost-sharing arrangement in an audit.
Cost Contribution Arrangements (CCAs) allow group entities to jointly fund the development of an intangible, a service, or another benefit, sharing costs in proportion to their expected benefit rather than paying a royalty or service fee after the fact. Common in R&D-heavy industries such as pharmaceuticals and technology, CCAs are attractive because they align cost-bearing with value creation from the outset. They are also, in the OECD's own words, one of the most audited arrangements in transfer pricing, precisely because getting the mechanics wrong can look indistinguishable from profit shifting.
The Core Design Question: Proportionate Contribution
Under Chapter VIII of the OECD Guidelines, each participant's contribution must be proportionate to its share of the overall expected benefits from the CCA activity, not to an arbitrary allocation key chosen for convenience. Benefit shares are typically projected using metrics such as anticipated sales, units expected to be sold or used, or operating expense ratios, whichever most reliably reflects the actual expected benefit. Because these are forward-looking estimates, CCAs require periodic testing against actual outcomes, and a persistent divergence between projected and actual benefit shares is itself a red flag for tax authorities.
Buy-in and Buy-out Payments
When a new participant joins a CCA, it must generally make a buy-in payment reflecting the value of existing contributions it is now entitled to exploit, effectively buying into pre-existing intangibles or capabilities the CCA has already generated. Conversely, when a participant exits, it is typically entitled to a buy-out payment from the remaining participants for the value of the interest it is relinquishing. Both events require a defensible valuation, and both are common flashpoints in disputes because valuing an unfinished R&D pipeline or a partially developed platform is inherently uncertain.
Balancing Payments
Where actual contributions diverge from proportionate benefit shares in a given period, balancing payments true up the arrangement, participants who contributed less than their benefit share compensate those who contributed more. Without a mechanism to make and document balancing payments, a CCA can silently drift into an arrangement where one entity is effectively subsidising the R&D of another, which tax authorities will recharacterise as a disguised service or financing transaction.
Documentation Expectations
A defensible CCA file should include the identity of participants and their respective interests, the scope of activity covered, the expected duration, procedures for admission, withdrawal and termination, the benefit-share methodology and underlying projections, and evidence that contributions were actually made in the form and amount described. Contemporaneous documentation is essential; retrofitting a CCA narrative after a benefit-share dispute arises rarely survives audit.
Governance as a Practical Safeguard
Beyond the technical mechanics, CCAs work best when governed by a standing committee with representatives from each participant, meeting at a set cadence to review benefit-share projections against actual outcomes, approve new admissions and withdrawals, and formally record any balancing payment required for the period. Groups that treat the CCA as a static legal document signed once and revisited only at audit time are far more exposed than those that treat it as a living governance process reviewed annually alongside the group's broader financial planning cycle.
Conclusion
A CCA is tested against Chapter VIII on three specific points: whether contributions are proportionate to projected benefit shares, whether buy-in and buy-out payments reflect the value of pre-existing and relinquished contributions, and whether balancing payments have actually been made where projected and actual benefit shares diverged. A CCA file that cannot evidence all three, contemporaneously, is functionally indistinguishable from an unpriced cost-sharing arrangement in an audit.
Read More

The Comparable Uncontrolled Price Method: Why the "Simplest" Method Is Often the Hardest to Apply
The Comparable Uncontrolled Price Method: Why the "Simplest" Method Is Often the Hardest to Apply
Of the five OECD - Recognised transfer pricing methods, the Comparable Uncontrolled Price (CUP) method is theoretically the purest. It compares the price charged in a controlled transaction directly to the price charged in a comparable uncontrolled transaction. No margins, no ratios, no allocation keys, just price against price. Practitioners are taught to prefer CUP whenever it can be reliably applied. In practice, however, CUP is frequently the method taxpayers reach for first and abandon soonest, because the standard of comparability it demands is unforgiving.
Internal CUP vs External CUP
An internal CUP exists where the tested party, or another group entity, also transacts with an independent party on materially similar terms, for instance, a manufacturer selling the same product to both a related distributor and an unrelated one. Internal CUPs are strongly preferred because the comparability factors (product, market, volume, timing) are easier to hold constant. An external CUP relies on transactions between two unrelated parties, typically sourced from public databases, industry price lists, or commodity exchanges. External CUPs are harder to defend because the practitioner rarely has visibility into contractual terms, credit periods, or volume discounts embedded in the third-party price
The Comparability Bar Is Higher Than for Any Other Method
Because CUP compares price directly rather than a margin or ratio, even small differences in product specification, delivery terms, contractual risk allocation, or the level of market (wholesale vs retail) can materially distort the result unless a reliable adjustment can be made. A profit-based method such as TNMM tolerates a wider band of product and functional differences because margins absorb some of that variance; CUP does not. This is precisely why tax authorities frequently reject external CUPs on comparability grounds even when the underlying price data is genuinely public and observable.
Where CUP Genuinely Works
CUP is most defensible for commodities with quoted market prices (crude oil, base metals, agricultural produce), for intra-group loans benchmarked against observable bond or loan pricing, for royalty rates where comparable third-party licence exist in the same industry, and for internal CUPs arising from parallel third-party sales of an identical product. The OECD's emerging minerals pricing framework for copper is itself a CUP-based approach, anchored to LME quotations and adjusted for grade, form, and delivery terms, illustrating that even a 'simple' method requires a sophisticated adjustment layer to survive scrutiny.
Common Pitfalls in Practice
The most frequent CUP failures include comparing prices from different points in the value chain without normalising for the functions performed at each, ignoring currency and payment term differences, treating list prices as transaction prices without accounting for rebates or discounts actually realised, and using average or aggregated data instead of transaction-specific data. Where these adjustments cannot be made reliably, practitioners are usually better served falling back to a profit-based method rather than forcing a comparability-strained CUP through.
Building a CUP That Survives Audit
A defensible CUP analysis documents the source of the comparable price transaction by transaction, records every contractual and market difference identified between the comparable and the controlled transaction, and shows the mathematics of each adjustment applied rather than presenting an adjusted price without a visible calculation trail. Practitioners who treat the adjustment process as the centrepiece of the CUP study, rather than a footnote to a headline price, tend to produce the analyses that withstand scrutiny when a tax authority asks how the final figure was actually derived.
Conclusion
CUP's apparent simplicity is deceptive. Chapter II, Part II tests price rather than margin, which puts CUP at the top of the method hierarchy in reliability terms but at the bottom in tolerance for comparability defects. A CUP position is only as strong as the adjustment schedule behind it, contractual terms, volume, currency, market level and delivery conditions each need a quantified, documented adjustment, or the price comparison itself, however factually accurate, will not meet the arm's length standard.
Of the five OECD - Recognised transfer pricing methods, the Comparable Uncontrolled Price (CUP) method is theoretically the purest. It compares the price charged in a controlled transaction directly to the price charged in a comparable uncontrolled transaction. No margins, no ratios, no allocation keys, just price against price. Practitioners are taught to prefer CUP whenever it can be reliably applied. In practice, however, CUP is frequently the method taxpayers reach for first and abandon soonest, because the standard of comparability it demands is unforgiving.
Internal CUP vs External CUP
An internal CUP exists where the tested party, or another group entity, also transacts with an independent party on materially similar terms, for instance, a manufacturer selling the same product to both a related distributor and an unrelated one. Internal CUPs are strongly preferred because the comparability factors (product, market, volume, timing) are easier to hold constant. An external CUP relies on transactions between two unrelated parties, typically sourced from public databases, industry price lists, or commodity exchanges. External CUPs are harder to defend because the practitioner rarely has visibility into contractual terms, credit periods, or volume discounts embedded in the third-party price
The Comparability Bar Is Higher Than for Any Other Method
Because CUP compares price directly rather than a margin or ratio, even small differences in product specification, delivery terms, contractual risk allocation, or the level of market (wholesale vs retail) can materially distort the result unless a reliable adjustment can be made. A profit-based method such as TNMM tolerates a wider band of product and functional differences because margins absorb some of that variance; CUP does not. This is precisely why tax authorities frequently reject external CUPs on comparability grounds even when the underlying price data is genuinely public and observable.
Where CUP Genuinely Works
CUP is most defensible for commodities with quoted market prices (crude oil, base metals, agricultural produce), for intra-group loans benchmarked against observable bond or loan pricing, for royalty rates where comparable third-party licence exist in the same industry, and for internal CUPs arising from parallel third-party sales of an identical product. The OECD's emerging minerals pricing framework for copper is itself a CUP-based approach, anchored to LME quotations and adjusted for grade, form, and delivery terms, illustrating that even a 'simple' method requires a sophisticated adjustment layer to survive scrutiny.
Common Pitfalls in Practice
The most frequent CUP failures include comparing prices from different points in the value chain without normalising for the functions performed at each, ignoring currency and payment term differences, treating list prices as transaction prices without accounting for rebates or discounts actually realised, and using average or aggregated data instead of transaction-specific data. Where these adjustments cannot be made reliably, practitioners are usually better served falling back to a profit-based method rather than forcing a comparability-strained CUP through.
Building a CUP That Survives Audit
A defensible CUP analysis documents the source of the comparable price transaction by transaction, records every contractual and market difference identified between the comparable and the controlled transaction, and shows the mathematics of each adjustment applied rather than presenting an adjusted price without a visible calculation trail. Practitioners who treat the adjustment process as the centrepiece of the CUP study, rather than a footnote to a headline price, tend to produce the analyses that withstand scrutiny when a tax authority asks how the final figure was actually derived.
Conclusion
CUP's apparent simplicity is deceptive. Chapter II, Part II tests price rather than margin, which puts CUP at the top of the method hierarchy in reliability terms but at the bottom in tolerance for comparability defects. A CUP position is only as strong as the adjustment schedule behind it, contractual terms, volume, currency, market level and delivery conditions each need a quantified, documented adjustment, or the price comparison itself, however factually accurate, will not meet the arm's length standard.
Read More

FAR Analysis and Comparability Analysis in Transfer Pricing Benchmarking
FAR Analysis and Comparability Analysis in Transfer Pricing Benchmarking
Transfer pricing requires that transactions between related parties be priced as if they occurred between unrelated parties an "arm's length" standard. Two critical frameworks Functional Analysis and Response (FAR) and Comparability Analysis form the foundation of effective benchmarking studies. Understanding these methodologies is essential for multinational enterprises defending their transfer pricing positions
1. Understanding FAR Analysis: Building the Foundation
Functional Analysis and Response (FAR analysis) is a systematic examination of the commercial reality of controlled transactions.
It documents three essential elements:
Functions: Activities and responsibilities undertaken by each party, including decision-making, management, and operational execution
Assets: Tangible and intangible assets deployed, including intellectual property, distribution networks, and customer relationships
Risks: Business risks assumed, such as market risk, credit risk, and financial risk
FAR analysis is critical because benchmarking without it is meaningless. Two distributors performing different functions (one providing extensive marketing and assuming inventory risk versus another with minimal functions) would logically command different margins. FAR analysis ensures:
Economic substance in transfer pricing methodologies
True comparability among selected comparable companies
Defensibility in regulatory scrutiny
Compliance with transfer pricing documentation requirements
A robust FAR analysis should include business team questionnaires, organizational charts, operational descriptions, and asset ownership evidence. Contemporaneous documentation created during the relevant tax year carries significantly more weight in tax disputes than retroactive documentation.
2. Comparability Analysis: Finding Your Economic Peers
Once FAR analysis establishes transaction characteristics, comparability analysis determines which independent transactions serve as reliable benchmarks. The OECD identifies five critical comparability factors:
Contractual Terms: Specific conditions governing the transaction and risk allocation
Functions, Assets, and Risks: Whether FAR characteristics are truly comparable
Economic Circumstances: Similar markets, geographic locations, and competitive environments
Business Strategies: Similar strategic approaches and growth objectives
Product/Service Characteristics: Quality, features, technology, and market positioning
In practice, perfect comparables rarely exist, so practitioners distinguish between "hard comparables" (readily available, highly similar) and "soft comparables" (requiring adjustment). Effective comparability analysis involves:
Identifying and accessing reliable financial data sources with comprehensive company information
Applying rigorous filtering criteria based on financial metrics and operational characteristics
Making statistical adjustments for differences in size, geography, product mix, or market conditions
Evaluating data quality, relevance, and reliability of information sources
Modern benchmarking uses statistical techniques including Interquartile Range (IQR) analysis, median and mean calculations, regression analysis, and sensitivity testing. The goal is establishing a defensible range of arm's length prices rather than selecting a single comparable company.
3. Integration and Application: From Analysis to Strategy
FAR and comparability analyses gain power through integration into a cohesive transfer pricing methodology. The OECD recognizes five primary methods, each relying differently on these analyses:
Comparable Uncontrolled Price (CUP): Directly compares to uncontrolled transactions
Resale Price Method: Benchmarks distributor gross margins
Cost Plus Method: Benchmarks manufacturer markups on costs
Profit Split Method: Allocates combined profits based on functions, assets, and risks
Transactional Net Margin Method (TNMM): Benchmarks net profit margins
Method selection depends on FAR analysis. Manufacturers should typically use Cost Plus; resellers should use Resale Price Method.
Best Practices for Implementation
Organizations should:
Establish clear governance and cross-functional alignment
Maintain contemporaneous documentation during the tax year
Conduct sensitivity testing to understand defensible pricing ranges
Monitor evolving transfer pricing regulations
Engage specialized transfer pricing advisors
Plan proactively before transactions occur
Transfer pricing documentation requirements now include Master Files, Local Files, and Country-by-Country Reporting, making rigorous FAR and comparability analysis essential.
Conclusion
FAR Analysis and Comparability Analysis are the foundation of robust transfer pricing. FAR Analysis identifies the functions performed, assets employed, and risks assumed by each entity, while Comparability Analysis benchmarks those transactions against similar independent dealings. Together, they ensure that intercompany pricing reflects commercial reality, strengthens compliance, and helps businesses withstand increasing scrutiny from tax authorities worldwide.
Transfer pricing requires that transactions between related parties be priced as if they occurred between unrelated parties an "arm's length" standard. Two critical frameworks Functional Analysis and Response (FAR) and Comparability Analysis form the foundation of effective benchmarking studies. Understanding these methodologies is essential for multinational enterprises defending their transfer pricing positions
1. Understanding FAR Analysis: Building the Foundation
Functional Analysis and Response (FAR analysis) is a systematic examination of the commercial reality of controlled transactions.
It documents three essential elements:
Functions: Activities and responsibilities undertaken by each party, including decision-making, management, and operational execution
Assets: Tangible and intangible assets deployed, including intellectual property, distribution networks, and customer relationships
Risks: Business risks assumed, such as market risk, credit risk, and financial risk
FAR analysis is critical because benchmarking without it is meaningless. Two distributors performing different functions (one providing extensive marketing and assuming inventory risk versus another with minimal functions) would logically command different margins. FAR analysis ensures:
Economic substance in transfer pricing methodologies
True comparability among selected comparable companies
Defensibility in regulatory scrutiny
Compliance with transfer pricing documentation requirements
A robust FAR analysis should include business team questionnaires, organizational charts, operational descriptions, and asset ownership evidence. Contemporaneous documentation created during the relevant tax year carries significantly more weight in tax disputes than retroactive documentation.
2. Comparability Analysis: Finding Your Economic Peers
Once FAR analysis establishes transaction characteristics, comparability analysis determines which independent transactions serve as reliable benchmarks. The OECD identifies five critical comparability factors:
Contractual Terms: Specific conditions governing the transaction and risk allocation
Functions, Assets, and Risks: Whether FAR characteristics are truly comparable
Economic Circumstances: Similar markets, geographic locations, and competitive environments
Business Strategies: Similar strategic approaches and growth objectives
Product/Service Characteristics: Quality, features, technology, and market positioning
In practice, perfect comparables rarely exist, so practitioners distinguish between "hard comparables" (readily available, highly similar) and "soft comparables" (requiring adjustment). Effective comparability analysis involves:
Identifying and accessing reliable financial data sources with comprehensive company information
Applying rigorous filtering criteria based on financial metrics and operational characteristics
Making statistical adjustments for differences in size, geography, product mix, or market conditions
Evaluating data quality, relevance, and reliability of information sources
Modern benchmarking uses statistical techniques including Interquartile Range (IQR) analysis, median and mean calculations, regression analysis, and sensitivity testing. The goal is establishing a defensible range of arm's length prices rather than selecting a single comparable company.
3. Integration and Application: From Analysis to Strategy
FAR and comparability analyses gain power through integration into a cohesive transfer pricing methodology. The OECD recognizes five primary methods, each relying differently on these analyses:
Comparable Uncontrolled Price (CUP): Directly compares to uncontrolled transactions
Resale Price Method: Benchmarks distributor gross margins
Cost Plus Method: Benchmarks manufacturer markups on costs
Profit Split Method: Allocates combined profits based on functions, assets, and risks
Transactional Net Margin Method (TNMM): Benchmarks net profit margins
Method selection depends on FAR analysis. Manufacturers should typically use Cost Plus; resellers should use Resale Price Method.
Best Practices for Implementation
Organizations should:
Establish clear governance and cross-functional alignment
Maintain contemporaneous documentation during the tax year
Conduct sensitivity testing to understand defensible pricing ranges
Monitor evolving transfer pricing regulations
Engage specialized transfer pricing advisors
Plan proactively before transactions occur
Transfer pricing documentation requirements now include Master Files, Local Files, and Country-by-Country Reporting, making rigorous FAR and comparability analysis essential.
Conclusion
FAR Analysis and Comparability Analysis are the foundation of robust transfer pricing. FAR Analysis identifies the functions performed, assets employed, and risks assumed by each entity, while Comparability Analysis benchmarks those transactions against similar independent dealings. Together, they ensure that intercompany pricing reflects commercial reality, strengthens compliance, and helps businesses withstand increasing scrutiny from tax authorities worldwide.
Read More

The Arm's Length Principle: The Foundation of Global Transfer Pricing
The Arm's Length Principle: The Foundation of Global Transfer Pricing
When two strangers negotiate a price, neither has a reason to overcharge or undercharge. The market disciplines them. But when a parent company sells goods to its own subsidiary in another country, under a different tax regime That natural discipline disappears. The price they agree on is no longer commercial; it is a choice. And that choice can shift billions in taxable profit from high-tax to low-tax jurisdictions.
The Arm's Length Principle ('ALP') is the international tax system's answer to this problem. It demands that transactions between related parties be priced as if they were conducted between independent parties under comparable circumstances. Simple in concept, complex in execution and increasingly contested as the global economy evolves.
What is the Arm's Length Principle?
At its core, the ALP asks a single question: what price would two unrelated parties agree to in this transaction? If a multinational's Indian subsidiary manufactures software components and sells them to its Irish holding company, the price must reflect what an independent manufacturer would charge an unrelated buyer in the open market.
"Each enterprise of a multinational group should be treated as a separate entity dealing at arm's length with all other members of the group." OECD Transfer Pricing Guidelines, Article 9 of the Model Tax Convention
This "separate entity" fiction is the cornerstone of international tax. Without it, a group with operations in 40 countries could route profits through whichever entity it likes. With it, tax authorities can challenge prices and demand adjustments, theoretically ensuring each country gets its fair share of the tax base.
The Four Pillars of Arm's length analysis -
Comparability
Find independent transactions that match the related-party deal in product, function, risk, and market conditions.
Functional analysis
Map who does what, who performs functions, who bears economic risks, who owns assets across the group.
Transfer pricing method
Apply CUP, cost-plus, resale price, TNMM, or profit split to determine the arm's length price or range.
Documentation
Maintain master files, local files, and country-by-country reports as required by BEPS Action 13.
Why the Arm's Length Principle Still Matters -
The Arm's Length Principle continues to serve as the foundation of the global transfer pricing framework, providing a consistent and internationally accepted standard for evaluating cross-border transactions between related parties. As businesses expand across jurisdictions and operating models become increasingly sophisticated, the principle plays a critical role in ensuring that intercompany arrangements reflect commercial realities and are supported by sound economic analysis.
While its application requires careful consideration of facts, functions, and market conditions, the Arm's Length Principle remains an essential tool for promoting transparency, managing tax risk, and fostering confidence in the international tax system.
When two strangers negotiate a price, neither has a reason to overcharge or undercharge. The market disciplines them. But when a parent company sells goods to its own subsidiary in another country, under a different tax regime That natural discipline disappears. The price they agree on is no longer commercial; it is a choice. And that choice can shift billions in taxable profit from high-tax to low-tax jurisdictions.
The Arm's Length Principle ('ALP') is the international tax system's answer to this problem. It demands that transactions between related parties be priced as if they were conducted between independent parties under comparable circumstances. Simple in concept, complex in execution and increasingly contested as the global economy evolves.
What is the Arm's Length Principle?
At its core, the ALP asks a single question: what price would two unrelated parties agree to in this transaction? If a multinational's Indian subsidiary manufactures software components and sells them to its Irish holding company, the price must reflect what an independent manufacturer would charge an unrelated buyer in the open market.
"Each enterprise of a multinational group should be treated as a separate entity dealing at arm's length with all other members of the group." OECD Transfer Pricing Guidelines, Article 9 of the Model Tax Convention
This "separate entity" fiction is the cornerstone of international tax. Without it, a group with operations in 40 countries could route profits through whichever entity it likes. With it, tax authorities can challenge prices and demand adjustments, theoretically ensuring each country gets its fair share of the tax base.
The Four Pillars of Arm's length analysis -
Comparability
Find independent transactions that match the related-party deal in product, function, risk, and market conditions.
Functional analysis
Map who does what, who performs functions, who bears economic risks, who owns assets across the group.
Transfer pricing method
Apply CUP, cost-plus, resale price, TNMM, or profit split to determine the arm's length price or range.
Documentation
Maintain master files, local files, and country-by-country reports as required by BEPS Action 13.
Why the Arm's Length Principle Still Matters -
The Arm's Length Principle continues to serve as the foundation of the global transfer pricing framework, providing a consistent and internationally accepted standard for evaluating cross-border transactions between related parties. As businesses expand across jurisdictions and operating models become increasingly sophisticated, the principle plays a critical role in ensuring that intercompany arrangements reflect commercial realities and are supported by sound economic analysis.
While its application requires careful consideration of facts, functions, and market conditions, the Arm's Length Principle remains an essential tool for promoting transparency, managing tax risk, and fostering confidence in the international tax system.
Read More

Amount B Decoded: The Simplified Transfer Pricing Method That's Splitting Jurisdictions in 2025
Amount B Decoded: The Simplified Transfer Pricing Method That's Splitting Jurisdictions in 2025
Amount B was heralded as one of the most practical outputs of the OECD's Two-Pillar project: a simplified, low-cost method for pricing routine marketing and distribution activities that would reduce disputes, particularly for lower-capacity jurisdictions. A year into its optional availability, the reality is more complicated, a patchwork of adoption, opt-outs, and elective procedures that challenges the very simplification it promised.
How Amount B Works
Amount B applies the arm's length principle to "in-scope" transactions involving baseline marketing distributors, wholesalers, sales agents, and commissionaires engaged in routine distribution of goods. Instead of conducting a full benchmarking exercise, eligible distributors apply a fixed return on sales from a reference matrix, with margins the OECD suggests range between 1.5% and 5.5% depending on the distributor type and country-specific adjustments. The Consolidated Report on Amount B was published on February 24, 2025, incorporating the framework into the OECD Transfer Pricing Guidelines.
Amount B is designed specifically for routine distributors. It does not apply to distributors that also perform significant non-distribution functions, own valuable intangibles, or assume material financial risks. Companies must self-assess eligibility before applying the fixed-margin approach.
The Opt-Out Problem
Australia, New Zealand, Norway, and Turkey have all formally opted out of Amount B. This creates a significant bilateral complication: a Singapore-based parent applying the SSA to a transaction with its Australian distributor cannot rely on Amount B because Australia has not adopted it. The receiving jurisdiction may apply its own traditional benchmarking approach, potentially resulting in double taxation rather than the simplification Amount B intended. For MNEs with distribution networks spanning both adopting and non-adopting jurisdictions, a transaction-by-transaction eligibility analysis remains essential.
US Adoption: Elective via Notice 2025-04
The US adopted Amount B on an elective basis through IRS Notice 2025-04, allowing MNEs to rely on the simplified approach for baseline marketing and distribution activities for taxable years beginning on or after January 1, 2025. This partial adoption means that US-parented groups may use Amount B for their outbound distribution relationships where both jurisdictions have adopted the approach, but cannot rely on it universally.
OECD Country Profile Updates: A Rolling Picture
The OECD has been releasing updated country profiles in batches throughout 2025 and into 2026. The third batch, published January 16, 2026, brings the total count to over 78 jurisdictions. Each profile now contains dedicated sections on hard-to-value intangibles and the SSA, providing a jurisdiction-by-jurisdiction overview of adoption status that practitioners can use to map their Amount B eligibility across complex global distribution networks.
Amount B was heralded as one of the most practical outputs of the OECD's Two-Pillar project: a simplified, low-cost method for pricing routine marketing and distribution activities that would reduce disputes, particularly for lower-capacity jurisdictions. A year into its optional availability, the reality is more complicated, a patchwork of adoption, opt-outs, and elective procedures that challenges the very simplification it promised.
How Amount B Works
Amount B applies the arm's length principle to "in-scope" transactions involving baseline marketing distributors, wholesalers, sales agents, and commissionaires engaged in routine distribution of goods. Instead of conducting a full benchmarking exercise, eligible distributors apply a fixed return on sales from a reference matrix, with margins the OECD suggests range between 1.5% and 5.5% depending on the distributor type and country-specific adjustments. The Consolidated Report on Amount B was published on February 24, 2025, incorporating the framework into the OECD Transfer Pricing Guidelines.
Amount B is designed specifically for routine distributors. It does not apply to distributors that also perform significant non-distribution functions, own valuable intangibles, or assume material financial risks. Companies must self-assess eligibility before applying the fixed-margin approach.
The Opt-Out Problem
Australia, New Zealand, Norway, and Turkey have all formally opted out of Amount B. This creates a significant bilateral complication: a Singapore-based parent applying the SSA to a transaction with its Australian distributor cannot rely on Amount B because Australia has not adopted it. The receiving jurisdiction may apply its own traditional benchmarking approach, potentially resulting in double taxation rather than the simplification Amount B intended. For MNEs with distribution networks spanning both adopting and non-adopting jurisdictions, a transaction-by-transaction eligibility analysis remains essential.
US Adoption: Elective via Notice 2025-04
The US adopted Amount B on an elective basis through IRS Notice 2025-04, allowing MNEs to rely on the simplified approach for baseline marketing and distribution activities for taxable years beginning on or after January 1, 2025. This partial adoption means that US-parented groups may use Amount B for their outbound distribution relationships where both jurisdictions have adopted the approach, but cannot rely on it universally.
OECD Country Profile Updates: A Rolling Picture
The OECD has been releasing updated country profiles in batches throughout 2025 and into 2026. The third batch, published January 16, 2026, brings the total count to over 78 jurisdictions. Each profile now contains dedicated sections on hard-to-value intangibles and the SSA, providing a jurisdiction-by-jurisdiction overview of adoption status that practitioners can use to map their Amount B eligibility across complex global distribution networks.
Read More

Cloud, Data Centres & High-Value Services: OECD's 2026 Discussion Drafts to Watch
Cloud, Data Centres & High-Value Services: OECD's 2026 Discussion Drafts to Watch
The OECD's 2026 work programme is set to target several of the most contested areas in digital economy transfer pricing. Discussion drafts are anticipated covering cloud services and data centre costs, the benefit test for intra-group services, cost pass-through arrangements, and high-value services. These are not minor clarifications they address structural gaps in the current TP guidelines that digital-native MNEs have exploited for over a decade.
Cloud Services: The Definitional Challenge
The transfer pricing treatment of cloud services sits in a genuinely contested space. When a parent entity provides cloud infrastructure to subsidiaries, is the charge best analysed as a technology service, a licence of software, or a rental of tangible property? The answer determines which TP method applies and which comparable data is relevant. Current OECD guidance, written before cloud computing matured, provides insufficient clarity and the upcoming discussion draft is expected to establish a classification framework that distinguishes IaaS, PaaS, and SaaS arrangements for TP purposes.
Data centre costs particularly where MNE groups have centralised AI computing infrastructure are emerging as a new frontier. The allocation of GPU cluster costs, cooling infrastructure, and bandwidth expenses between related parties is an area of growing controversy, with several large tech companies already under audit in multiple jurisdictions.
The Benefit Test under Scrutiny
The benefit test the requirement that an intra-group service charge must provide a genuine economic benefit to the recipient to be deductible is increasingly the subject of tax authority challenge. In the current environment, where MNEs frequently charge subsidiaries for centralised AI development costs, market intelligence platforms, and group-wide data lakes, tax authorities are questioning whether local entities truly benefit from these shared investments or whether charges are merely fee-skimming mechanisms to shift profits to IP jurisdictions.
What MNEs Should Do to Prepare
Companies with significant digital service flows between related parties should conduct a pre-emptive review of their benefit test documentation for intra-group technology and data charges. Cost-sharing arrangements covering AI model training and deployment should be scrutinised against the existing OECD guidance on cost contribution arrangements and the anticipated new discussion drafts. Engaging with the consultation process expected to open to public comment in mid-2026 provides an opportunity to influence standards before they are finalised.
The OECD's 2026 work programme is set to target several of the most contested areas in digital economy transfer pricing. Discussion drafts are anticipated covering cloud services and data centre costs, the benefit test for intra-group services, cost pass-through arrangements, and high-value services. These are not minor clarifications they address structural gaps in the current TP guidelines that digital-native MNEs have exploited for over a decade.
Cloud Services: The Definitional Challenge
The transfer pricing treatment of cloud services sits in a genuinely contested space. When a parent entity provides cloud infrastructure to subsidiaries, is the charge best analysed as a technology service, a licence of software, or a rental of tangible property? The answer determines which TP method applies and which comparable data is relevant. Current OECD guidance, written before cloud computing matured, provides insufficient clarity and the upcoming discussion draft is expected to establish a classification framework that distinguishes IaaS, PaaS, and SaaS arrangements for TP purposes.
Data centre costs particularly where MNE groups have centralised AI computing infrastructure are emerging as a new frontier. The allocation of GPU cluster costs, cooling infrastructure, and bandwidth expenses between related parties is an area of growing controversy, with several large tech companies already under audit in multiple jurisdictions.
The Benefit Test under Scrutiny
The benefit test the requirement that an intra-group service charge must provide a genuine economic benefit to the recipient to be deductible is increasingly the subject of tax authority challenge. In the current environment, where MNEs frequently charge subsidiaries for centralised AI development costs, market intelligence platforms, and group-wide data lakes, tax authorities are questioning whether local entities truly benefit from these shared investments or whether charges are merely fee-skimming mechanisms to shift profits to IP jurisdictions.
What MNEs Should Do to Prepare
Companies with significant digital service flows between related parties should conduct a pre-emptive review of their benefit test documentation for intra-group technology and data charges. Cost-sharing arrangements covering AI model training and deployment should be scrutinised against the existing OECD guidance on cost contribution arrangements and the anticipated new discussion drafts. Engaging with the consultation process expected to open to public comment in mid-2026 provides an opportunity to influence standards before they are finalised.
Read More

Pricing the Earth: OECD's New Transfer Pricing Framework for Copper & Minerals
Pricing the Earth: OECD's New Transfer Pricing Framework for Copper & Minerals
The OECD launched a public consultation on a new transfer pricing framework for minerals, beginning with copper. The initiative titled "Determining the Price of Minerals: A Transfer Pricing Framework for Copper" is specifically designed to help resource-rich developing nations protect their tax base from a well-documented phenomenon: the systematic underpricing of mineral exports by multinational mining companies to related-party trading hubs in low-tax jurisdictions.
Copper represents the OECD's starting point, but the framework is intended to be extendable to other hard-to-value commodities including gold, cobalt, lithium, and rare earth elements making it relevant across virtually all major mining jurisdictions from the Democratic Republic of Congo to Chile and Australia.
Why Minerals Are a Transfer Pricing Flashpoint
Unlike manufactured goods or services, commodity pricing in related-party transactions is notoriously difficult to benchmark. Copper, for example, trades on global exchanges like the London Metal Exchange (LME), but the price actually received by a related-party trading hub depends on grade, form, delivery terms, hedging arrangements, and market timing. MNEs have historically exploited these variables to shift value from mine-level entities in high-tax African or Latin American jurisdictions to Swiss or Singapore-based commodity trading affiliates.
The Framework's Approach
The OECD's proposed framework establishes a commodity-specific comparable uncontrolled price (CUP) methodology, anchored to quoted market prices but adjusted for processing, transport, insurance, and quality differentials. For copper, this means establishing clear rules around which LME pricing benchmark applies, how provisional pricing arrangements are treated, and how marketing commissions charged by related trading hubs are scrutinised under the arm's length standard.
Low-Capacity Jurisdictions in Focus
A central motivation for the minerals framework is capacity building. Many developing nations that host major mining operations lack the tax authority expertise to challenge sophisticated transfer pricing structures used by global mining companies. The OECD's framework provides a standardised analytical template that even under-resourced tax administrations can apply potentially unlocking billions in additional tax revenue for jurisdictions that have long been on the losing side of TP disputes with the mining sector.
The OECD launched a public consultation on a new transfer pricing framework for minerals, beginning with copper. The initiative titled "Determining the Price of Minerals: A Transfer Pricing Framework for Copper" is specifically designed to help resource-rich developing nations protect their tax base from a well-documented phenomenon: the systematic underpricing of mineral exports by multinational mining companies to related-party trading hubs in low-tax jurisdictions.
Copper represents the OECD's starting point, but the framework is intended to be extendable to other hard-to-value commodities including gold, cobalt, lithium, and rare earth elements making it relevant across virtually all major mining jurisdictions from the Democratic Republic of Congo to Chile and Australia.
Why Minerals Are a Transfer Pricing Flashpoint
Unlike manufactured goods or services, commodity pricing in related-party transactions is notoriously difficult to benchmark. Copper, for example, trades on global exchanges like the London Metal Exchange (LME), but the price actually received by a related-party trading hub depends on grade, form, delivery terms, hedging arrangements, and market timing. MNEs have historically exploited these variables to shift value from mine-level entities in high-tax African or Latin American jurisdictions to Swiss or Singapore-based commodity trading affiliates.
The Framework's Approach
The OECD's proposed framework establishes a commodity-specific comparable uncontrolled price (CUP) methodology, anchored to quoted market prices but adjusted for processing, transport, insurance, and quality differentials. For copper, this means establishing clear rules around which LME pricing benchmark applies, how provisional pricing arrangements are treated, and how marketing commissions charged by related trading hubs are scrutinised under the arm's length standard.
Low-Capacity Jurisdictions in Focus
A central motivation for the minerals framework is capacity building. Many developing nations that host major mining operations lack the tax authority expertise to challenge sophisticated transfer pricing structures used by global mining companies. The OECD's framework provides a standardised analytical template that even under-resourced tax administrations can apply potentially unlocking billions in additional tax revenue for jurisdictions that have long been on the losing side of TP disputes with the mining sector.
Read More

The EU Transfer Pricing Directive: Moving Towards Unified Rules by 2026
The EU Transfer Pricing Directive: Moving Towards Unified Rules by 2026
The European Union is moving decisively to harmonise transfer pricing rules across all 27 member states. The proposed EU TP Directive targeting a January 1, 2026 implementation date would codify the arm's length principle into EU law, reducing the patchwork of domestic interpretations that have long created profit-shifting opportunities and double-taxation disputes for cross-border groups.
What the Directive Proposes
The proposed directive aligns with the latest OECD Transfer Pricing Guidelines and explicitly acknowledges the possibility that future guidelines may be issued by the United Nations, a nod to growing pressure from developing countries to move beyond the OECD's traditional framework. Key provisions include a harmonised definition of associated enterprises, standardised documentation requirements, and a unified dispute resolution mechanism for intra-EU TP disagreements.
The European Parliament adopted its non-binding report on the directive in April 2024. While the implementation timeline of January 1, 2026 remains aspirational given the complexity of EU legislative processes, pressure from Pillar Two implementation is accelerating adoption across member states.
The US Withdrawal Complication
The Trump administration's withdrawal from the global tax deal has created significant uncertainty in Europe. Several member states are closely monitoring Pillar One's fate particularly Amount A, the profit reallocation mechanism for highly profitable digital companies before committing to domestic legislative changes. Luxembourg, for example, has explicitly stated it is monitoring international developments before making legislative adjustments. This creates a two-speed EU TP landscape where some jurisdictions move swiftly and others wait for geopolitical clarity.
Amount B Adoption Across the EU
The EU's approach to Amount B is characteristically fragmented: the Directive leaves adoption to individual member states. This means MNEs with distribution operations across multiple EU countries may face a mosaic of Amount B adoption complicating the very simplification the mechanism promised. Germany, France, and the Netherlands are among the larger jurisdictions still deliberating, while some smaller member states have moved more quickly to confirm adoption starting from fiscal years commencing on or after January 1, 2025.
The European Union is moving decisively to harmonise transfer pricing rules across all 27 member states. The proposed EU TP Directive targeting a January 1, 2026 implementation date would codify the arm's length principle into EU law, reducing the patchwork of domestic interpretations that have long created profit-shifting opportunities and double-taxation disputes for cross-border groups.
What the Directive Proposes
The proposed directive aligns with the latest OECD Transfer Pricing Guidelines and explicitly acknowledges the possibility that future guidelines may be issued by the United Nations, a nod to growing pressure from developing countries to move beyond the OECD's traditional framework. Key provisions include a harmonised definition of associated enterprises, standardised documentation requirements, and a unified dispute resolution mechanism for intra-EU TP disagreements.
The European Parliament adopted its non-binding report on the directive in April 2024. While the implementation timeline of January 1, 2026 remains aspirational given the complexity of EU legislative processes, pressure from Pillar Two implementation is accelerating adoption across member states.
The US Withdrawal Complication
The Trump administration's withdrawal from the global tax deal has created significant uncertainty in Europe. Several member states are closely monitoring Pillar One's fate particularly Amount A, the profit reallocation mechanism for highly profitable digital companies before committing to domestic legislative changes. Luxembourg, for example, has explicitly stated it is monitoring international developments before making legislative adjustments. This creates a two-speed EU TP landscape where some jurisdictions move swiftly and others wait for geopolitical clarity.
Amount B Adoption Across the EU
The EU's approach to Amount B is characteristically fragmented: the Directive leaves adoption to individual member states. This means MNEs with distribution operations across multiple EU countries may face a mosaic of Amount B adoption complicating the very simplification the mechanism promised. Germany, France, and the Netherlands are among the larger jurisdictions still deliberating, while some smaller member states have moved more quickly to confirm adoption starting from fiscal years commencing on or after January 1, 2025.
Read More

Canada's Bill C-15: The Most Consequential Transfer Pricing Modernisation in a Generation
Canada's Bill C-15: The Most Consequential Transfer Pricing Modernisation in a Generation
Canada's Bill C-15 represents a generational shift in how the country approaches transfer pricing compliance. Taking effect for taxation years beginning after November 4, 2025, the legislation embeds OECD transfer pricing principles directly into Canadian law, aligns documentation obligations with international standards, and dramatically tightens the Canada Revenue Agency's (CRA's) access to taxpayer information.
The 30-Day Documentation Rule
Perhaps the most operationally significant change is the compression of the CRA's documentation response window. Previously, MNEs had considerably more time to compile and submit transfer pricing documentation upon request. Under Bill C-15, this window is shortened to 30 days, a standard that will require companies to maintain truly contemporaneous documentation rather than preparing records in response to audit triggers.
Companies with historically reactive TP documentation practices face immediate risk under the new 30-day standard. Those without a maintained, contemporaneous Master File and Local File should begin remediation immediately for fiscal years beginning after November 4, 2025.
Expanded Documentation & Penalty Thresholds
Bill C-15 expands the scope of documentation obligations and increases penalty thresholds for non-compliance, creating stronger incentives for proactive TP governance. The legislation also tightens delineation analysis requirements the process of accurately characterising transactions between related parties bringing Canadian practice into closer alignment with OECD Chapter I standards. In parallel, the Global Minimum Tax Act continues to advance Canada's Pillar Two implementation, with further guidance and legislative refinement expected throughout 2026.
Interaction with Pillar Two
Canada's Pillar Two implementation creates an important interaction dynamic: TP policies must not artificially depress effective tax rates, as tax authorities are expected to scrutinise intercompany pricing specifically for its effect on Qualified Domestic Minimum Top-Up Tax (QDMTT) calculations. Robust TP documentation will be essential not only for traditional audit defence but for demonstrating appropriate ETR outcomes under GloBE.
Canada's Bill C-15 represents a generational shift in how the country approaches transfer pricing compliance. Taking effect for taxation years beginning after November 4, 2025, the legislation embeds OECD transfer pricing principles directly into Canadian law, aligns documentation obligations with international standards, and dramatically tightens the Canada Revenue Agency's (CRA's) access to taxpayer information.
The 30-Day Documentation Rule
Perhaps the most operationally significant change is the compression of the CRA's documentation response window. Previously, MNEs had considerably more time to compile and submit transfer pricing documentation upon request. Under Bill C-15, this window is shortened to 30 days, a standard that will require companies to maintain truly contemporaneous documentation rather than preparing records in response to audit triggers.
Companies with historically reactive TP documentation practices face immediate risk under the new 30-day standard. Those without a maintained, contemporaneous Master File and Local File should begin remediation immediately for fiscal years beginning after November 4, 2025.
Expanded Documentation & Penalty Thresholds
Bill C-15 expands the scope of documentation obligations and increases penalty thresholds for non-compliance, creating stronger incentives for proactive TP governance. The legislation also tightens delineation analysis requirements the process of accurately characterising transactions between related parties bringing Canadian practice into closer alignment with OECD Chapter I standards. In parallel, the Global Minimum Tax Act continues to advance Canada's Pillar Two implementation, with further guidance and legislative refinement expected throughout 2026.
Interaction with Pillar Two
Canada's Pillar Two implementation creates an important interaction dynamic: TP policies must not artificially depress effective tax rates, as tax authorities are expected to scrutinise intercompany pricing specifically for its effect on Qualified Domestic Minimum Top-Up Tax (QDMTT) calculations. Robust TP documentation will be essential not only for traditional audit defence but for demonstrating appropriate ETR outcomes under GloBE.
Read More

Singapore TPG8 & Pillar Two: What Asia's Tax Hub Is Signalling to Multinationals
Singapore TPG8 & Pillar Two: What Asia's Tax Hub Is Signalling to Multinationals
Singapore's IRAS released its 8th Edition Transfer Pricing Guidelines (TPG8) in November 2025 just 18 months after the previous edition. The speed of the update signals IRAS's intent to stay closely aligned with international developments. Simultaneously, Singapore's Pillar Two registration portal opens in May 2026, with a hard deadline of June 30, 2026 for most MNE groups under the Multinational Enterprise (Minimum Tax) Act 2024 (MMT Act).
Key Changes in TPG8
Among the most welcome changes in TPG8 is IRAS's decision to exempt domestic intra-group loans from TP scrutiny. Where two Singapore entities neither being a bank transact via intra-group lending, IRAS will no longer challenge the interest rate or require TP documentation for loans entered into from January 1, 2025 onwards. This removes a real compliance burden for Singapore-domiciled groups.
Singapore's 2026 indicative margin for intra-group loans is set at +180 basis points above the applicable risk-free rate a benchmark that provides clear pricing guidance for treasury functions managing intercompany financing.
Amount B Adoption: A Cautious Pilot
Singapore launched its Amount B pilot on January 1, 2026, running through December 31, 2028 a year later than the OECD's recommended start date of January 1, 2025, reflecting Singapore's characteristically careful implementation approach. The Simplified and Streamlined Approach (SSA) is entirely optional, and crucially, TP documentation must still be maintained even when using it. Given that jurisdictions including Australia, New Zealand, Norway, and Turkey have opted out, Singapore taxpayers should verify whether their counterparty's jurisdiction has adopted Amount B before relying on the SSA.
Pillar Two Implementation
Singapore enacted the MMT Act in October 2024, and the GloBE Rules are now effective for financial years beginning on or after January 1, 2025. The two key mechanisms are the Domestic Top-up Tax (DTT) which tops up Singapore-sourced profits to 15% if the group's local ETR falls short and the Multinational Enterprise Top-up Tax (MTT), which operates as the Income Inclusion Rule (IIR) for Singapore-based parent entities with undertaxed overseas subsidiaries.
Singapore's IRAS released its 8th Edition Transfer Pricing Guidelines (TPG8) in November 2025 just 18 months after the previous edition. The speed of the update signals IRAS's intent to stay closely aligned with international developments. Simultaneously, Singapore's Pillar Two registration portal opens in May 2026, with a hard deadline of June 30, 2026 for most MNE groups under the Multinational Enterprise (Minimum Tax) Act 2024 (MMT Act).
Key Changes in TPG8
Among the most welcome changes in TPG8 is IRAS's decision to exempt domestic intra-group loans from TP scrutiny. Where two Singapore entities neither being a bank transact via intra-group lending, IRAS will no longer challenge the interest rate or require TP documentation for loans entered into from January 1, 2025 onwards. This removes a real compliance burden for Singapore-domiciled groups.
Singapore's 2026 indicative margin for intra-group loans is set at +180 basis points above the applicable risk-free rate a benchmark that provides clear pricing guidance for treasury functions managing intercompany financing.
Amount B Adoption: A Cautious Pilot
Singapore launched its Amount B pilot on January 1, 2026, running through December 31, 2028 a year later than the OECD's recommended start date of January 1, 2025, reflecting Singapore's characteristically careful implementation approach. The Simplified and Streamlined Approach (SSA) is entirely optional, and crucially, TP documentation must still be maintained even when using it. Given that jurisdictions including Australia, New Zealand, Norway, and Turkey have opted out, Singapore taxpayers should verify whether their counterparty's jurisdiction has adopted Amount B before relying on the SSA.
Pillar Two Implementation
Singapore enacted the MMT Act in October 2024, and the GloBE Rules are now effective for financial years beginning on or after January 1, 2025. The two key mechanisms are the Domestic Top-up Tax (DTT) which tops up Singapore-sourced profits to 15% if the group's local ETR falls short and the Multinational Enterprise Top-up Tax (MTT), which operates as the Income Inclusion Rule (IIR) for Singapore-based parent entities with undertaxed overseas subsidiaries.
Read More

HMRC's £3.4 Billion Windfall & the Biggest UK Transfer Pricing Overhaul Since 2004
HMRC's £3.4 Billion Windfall & the Biggest UK Transfer Pricing Overhaul Since 2004
HMRC's 2024–25 annual statistics, published on March 11, 2026, delivered a striking headline: transfer pricing yield nearly doubled to £3,387 million from £1,786 million in the prior year. With approximately 400 full-time equivalent staff dedicated to TP enforcement and a £13.8 billion pipeline of international tax under consideration, the message to multinationals is unmistakable, the UK is in an era of hyper-active enforcement.
The proposed UK reforms, effective January 1, 2026 for most provisions, represent the most significant overhaul of UK transfer pricing compliance rules since 2004 replacing the Diverted Profits Tax with a new "Unassessed Transfer Pricing Profits" (UTPP) regime charged at 31%.
The End of the SME Exemption
On April 28, 2025, HMRC launched a sweeping consultation. The flagship change is the removal of the TP exemption for medium-sized enterprises a long-standing safe harbour that kept many growing businesses out of the formal TP compliance regime. Under the proposals, the exemption will be narrowed to apply only to "small enterprises," with revised thresholds. This means thousands of mid-market groups with cross-border activity will need to implement arm's length pricing policies and contemporaneous documentation for the first time.
The International Controlled Transactions Schedule (ICTS)
All UK companies and permanent establishments outside the small enterprise definition will be required to file an ICTS if aggregate cross-border related-party transactions exceed £1 million. The schedule requires detailed disclosure by transaction type, counterparty, and TP method (de minimis £100k), plus loan data for balances above £5 million, and binary risk-flag questions to assist HMRC's risk-based triage.
Diverted Profits Tax Replaced
The Diverted Profits Tax, introduced in 2015 at a punitive 25% rate, will be repealed and absorbed into UK corporation tax as the Unassessed Transfer Pricing Profits (UTPP) regime applicable to accounting periods commencing on or after January 1, 2026. DPT notifications received by HMRC surged from 16 to 42 in 2024–25, reflecting heightened enforcement in the final year of the DPT regime. Notably, the new UTPP rate of 31% is higher than the standard UK corporation tax rate of 25%, preserving the deterrent effect.
HMRC's 2024–25 annual statistics, published on March 11, 2026, delivered a striking headline: transfer pricing yield nearly doubled to £3,387 million from £1,786 million in the prior year. With approximately 400 full-time equivalent staff dedicated to TP enforcement and a £13.8 billion pipeline of international tax under consideration, the message to multinationals is unmistakable, the UK is in an era of hyper-active enforcement.
The proposed UK reforms, effective January 1, 2026 for most provisions, represent the most significant overhaul of UK transfer pricing compliance rules since 2004 replacing the Diverted Profits Tax with a new "Unassessed Transfer Pricing Profits" (UTPP) regime charged at 31%.
The End of the SME Exemption
On April 28, 2025, HMRC launched a sweeping consultation. The flagship change is the removal of the TP exemption for medium-sized enterprises a long-standing safe harbour that kept many growing businesses out of the formal TP compliance regime. Under the proposals, the exemption will be narrowed to apply only to "small enterprises," with revised thresholds. This means thousands of mid-market groups with cross-border activity will need to implement arm's length pricing policies and contemporaneous documentation for the first time.
The International Controlled Transactions Schedule (ICTS)
All UK companies and permanent establishments outside the small enterprise definition will be required to file an ICTS if aggregate cross-border related-party transactions exceed £1 million. The schedule requires detailed disclosure by transaction type, counterparty, and TP method (de minimis £100k), plus loan data for balances above £5 million, and binary risk-flag questions to assist HMRC's risk-based triage.
Diverted Profits Tax Replaced
The Diverted Profits Tax, introduced in 2015 at a punitive 25% rate, will be repealed and absorbed into UK corporation tax as the Unassessed Transfer Pricing Profits (UTPP) regime applicable to accounting periods commencing on or after January 1, 2026. DPT notifications received by HMRC surged from 16 to 42 in 2024–25, reflecting heightened enforcement in the final year of the DPT regime. Notably, the new UTPP rate of 31% is higher than the standard UK corporation tax rate of 25%, preserving the deterrent effect.
Read More

Coca-Cola vs. IRS: The $18 Billion Transfer Pricing Battle That Rewrites the Rulebook
Coca-Cola vs. IRS: The $18 Billion Transfer Pricing Battle That Rewrites the Rulebook
Few corporate tax disputes in history carry the weight of Coca-Cola Company & Subsidiaries v. Commissioner. Now before the 11th Circuit Court of Appeals after a decade of Tax Court litigation, the case puts up to $18 billion in potential liability on the line and raises fundamental questions about IRS authority to retroactively change accepted transfer pricing methodologies.
The Origins: A 1996 Closing Agreement and the "10-50-50 Method"
The dispute traces back to a 1996 IRS closing agreement resolving Coca-Cola's transfer pricing for 1987–1995. Under this "10-50-50 method," supply point subsidiaries in Brazil, Chile, Costa Rica, Ireland, Mexico, and Swaziland retained profits equal to 10% of gross sales, with residual profits split equally between the US parent and foreign supply points. The IRS accepted this method for 11 consecutive audit cycles then abruptly changed course in 2011, applying the Comparable Profits Method (CPM) to tax years 2007–2009, generating $9 billion in adjustments.
Coca-Cola deposited over $6 billion with the IRS in September 2024 to cover deficiencies and accrued interest. The company estimates its total potential exposure if the IRS's methodology is applied through current years at approximately $18 billion.
The Core Legal Questions
Coca-Cola's appellate brief, filed February 25, 2025, raises two critical arguments. First, that the IRS engaged in an arbitrary and capricious "bait-and-switch" by applying a new methodology retroactively after years of acquiescence. Second, that the CPM-based allocations were substantively flawed particularly in how they ignored the Costa Rican supply point's $53 million annual marketing spend, instead assigning returns based only on tangible asset investment.
The case carries industry-wide implications: if the 11th Circuit upholds the IRS position, tax authorities in other jurisdictions may claim that local marketing activities create taxable profit locally potentially triggering a global wave of TP reassessments for IP-rich MNEs.
Parallel Controversy: The Amgen Disclosure Case
Running alongside Coca-Cola is a securities class action against Amgen, where a judge colourfully compared the company's omission of a $10.7 billion IRS transfer pricing dispute from its SEC filings to a child saying they "had dessert" when they had eaten "the whole cake." Together, these cases signal a new era of heightened disclosure expectations around TP exposures.
IRS Capacity Crisis
Complicating enforcement, the IRS lost approximately 25% of its workforce through DOGE-related reductions, cycling through six commissioners in under a year, and faced a government shutdown in October 2025. The House subcommittee approved further budget cuts to $9.8 billion for fiscal 2026. Despite constrained resources, the IRS continues to carry an unusually large inventory of TP disputes in Tax Court, district courts, and circuit courts.
Few corporate tax disputes in history carry the weight of Coca-Cola Company & Subsidiaries v. Commissioner. Now before the 11th Circuit Court of Appeals after a decade of Tax Court litigation, the case puts up to $18 billion in potential liability on the line and raises fundamental questions about IRS authority to retroactively change accepted transfer pricing methodologies.
The Origins: A 1996 Closing Agreement and the "10-50-50 Method"
The dispute traces back to a 1996 IRS closing agreement resolving Coca-Cola's transfer pricing for 1987–1995. Under this "10-50-50 method," supply point subsidiaries in Brazil, Chile, Costa Rica, Ireland, Mexico, and Swaziland retained profits equal to 10% of gross sales, with residual profits split equally between the US parent and foreign supply points. The IRS accepted this method for 11 consecutive audit cycles then abruptly changed course in 2011, applying the Comparable Profits Method (CPM) to tax years 2007–2009, generating $9 billion in adjustments.
Coca-Cola deposited over $6 billion with the IRS in September 2024 to cover deficiencies and accrued interest. The company estimates its total potential exposure if the IRS's methodology is applied through current years at approximately $18 billion.
The Core Legal Questions
Coca-Cola's appellate brief, filed February 25, 2025, raises two critical arguments. First, that the IRS engaged in an arbitrary and capricious "bait-and-switch" by applying a new methodology retroactively after years of acquiescence. Second, that the CPM-based allocations were substantively flawed particularly in how they ignored the Costa Rican supply point's $53 million annual marketing spend, instead assigning returns based only on tangible asset investment.
The case carries industry-wide implications: if the 11th Circuit upholds the IRS position, tax authorities in other jurisdictions may claim that local marketing activities create taxable profit locally potentially triggering a global wave of TP reassessments for IP-rich MNEs.
Parallel Controversy: The Amgen Disclosure Case
Running alongside Coca-Cola is a securities class action against Amgen, where a judge colourfully compared the company's omission of a $10.7 billion IRS transfer pricing dispute from its SEC filings to a child saying they "had dessert" when they had eaten "the whole cake." Together, these cases signal a new era of heightened disclosure expectations around TP exposures.
IRS Capacity Crisis
Complicating enforcement, the IRS lost approximately 25% of its workforce through DOGE-related reductions, cycling through six commissioners in under a year, and faced a government shutdown in October 2025. The House subcommittee approved further budget cuts to $9.8 billion for fiscal 2026. Despite constrained resources, the IRS continues to carry an unusually large inventory of TP disputes in Tax Court, district courts, and circuit courts.
Read More

India Shatters APA Records: 174 Agreements in a Single Year and What Comes Next
India Shatters APA Records: 174 Agreements in a Single Year and What Comes Next
India's transfer pricing landscape has undergone a remarkable transformation. In FY 2024–25, the Central Board of Direct Taxes (CBDT) signed a record 174 Advance Pricing Agreements, the highest in any single financial year since the programme's launch in 2012. Cumulative APAs now stand at 815, comprising 615 unilateral and 200 bilateral or multilateral agreements, touching counterparts in Australia, Japan, Singapore, South Korea, the Netherlands, the UK, and the US.
The 174 APAs signed in FY 2024–25 alone brought tax certainty covering 970 years of transfer pricing positions across Indian multinationals, a remarkable statistic that underscores how the programme is reshaping India's relationship with cross-border tax.
The New Multi-Year Arm's Length Pricing Mechanism
The Finance Act, 2025 introduced a landmark amendment to Section 92CA of the Income-tax Act, 1961: a "repeat-transaction" mechanism. Under this framework, taxpayers may opt to apply the arm's length price (ALP) determined for a particular assessment year to "similar" international or specified domestic transactions for the two immediately succeeding years. This dramatically reduces the compliance burden for routine, low-risk cross-border transactions.
Safe Harbour Expansion: Key Changes
Notification No. 21/2025 (March 25, 2025) introduced significant amendments to India's Safe Harbour Rules. Highlights include the elevation of the value limit for specified international transactions from INR 2 billion to INR 3 billion, enabling more taxpayers to benefit. Additionally, Safe Harbour applicability is now confirmed for two consecutive assessment years AY 2025–26 and AY 2026–27 restoring earlier practice and providing greater planning certainty.
IT/ITES services: Minimum margin of 18% for software development and IT-enabled services
R&D services: Margin of 24% for software or pharmaceutical R&D
Intra-group loans: Interest within LIBOR-plus prescribed margins
Corporate guarantees: Minimum commission rate of 1%
Strategic Implications for MNEs
India's Global Capability Centres (GCCs) have emerged as a key interface for TP compliance, with 76% of GCCs now handling cross-border tax operations including benchmarking and documentation. For multinationals, the clear policy signal from CBDT is that proactive APA filing rather than reactive audit defence is the preferred route. APAs resolved over 80% of covered disputes within two years, making them far more cost-effective than litigation in a system where just 300 Transfer Pricing Officers manage over 40,000 MNE cases.
India's transfer pricing landscape has undergone a remarkable transformation. In FY 2024–25, the Central Board of Direct Taxes (CBDT) signed a record 174 Advance Pricing Agreements, the highest in any single financial year since the programme's launch in 2012. Cumulative APAs now stand at 815, comprising 615 unilateral and 200 bilateral or multilateral agreements, touching counterparts in Australia, Japan, Singapore, South Korea, the Netherlands, the UK, and the US.
The 174 APAs signed in FY 2024–25 alone brought tax certainty covering 970 years of transfer pricing positions across Indian multinationals, a remarkable statistic that underscores how the programme is reshaping India's relationship with cross-border tax.
The New Multi-Year Arm's Length Pricing Mechanism
The Finance Act, 2025 introduced a landmark amendment to Section 92CA of the Income-tax Act, 1961: a "repeat-transaction" mechanism. Under this framework, taxpayers may opt to apply the arm's length price (ALP) determined for a particular assessment year to "similar" international or specified domestic transactions for the two immediately succeeding years. This dramatically reduces the compliance burden for routine, low-risk cross-border transactions.
Safe Harbour Expansion: Key Changes
Notification No. 21/2025 (March 25, 2025) introduced significant amendments to India's Safe Harbour Rules. Highlights include the elevation of the value limit for specified international transactions from INR 2 billion to INR 3 billion, enabling more taxpayers to benefit. Additionally, Safe Harbour applicability is now confirmed for two consecutive assessment years AY 2025–26 and AY 2026–27 restoring earlier practice and providing greater planning certainty.
IT/ITES services: Minimum margin of 18% for software development and IT-enabled services
R&D services: Margin of 24% for software or pharmaceutical R&D
Intra-group loans: Interest within LIBOR-plus prescribed margins
Corporate guarantees: Minimum commission rate of 1%
Strategic Implications for MNEs
India's Global Capability Centres (GCCs) have emerged as a key interface for TP compliance, with 76% of GCCs now handling cross-border tax operations including benchmarking and documentation. For multinationals, the clear policy signal from CBDT is that proactive APA filing rather than reactive audit defence is the preferred route. APAs resolved over 80% of covered disputes within two years, making them far more cost-effective than litigation in a system where just 300 Transfer Pricing Officers manage over 40,000 MNE cases.
Read More

The OECD's "Side-by-Side" Package: Securing the Future of Pillar Two in an Era of US Withdrawal
The OECD's "Side-by-Side" Package: Securing the Future of Pillar Two in an Era of US Withdrawal
When the United States President signed the White House memorandum on January 20, 2025, withdrawing the United States from the OECD's global tax deal, many observers feared the entire Pillar Two edifice would collapse. Eleven months later, the OECD delivered its answer: an 88-page guidance package that introduces four new safe harbours, extends the transitional Country-by-Country Reporting (CbCR) safe harbour, and formalises the "Side-by-Side" (SbS) system agreed by the G7 and the US on June 28, 2025.
The SbS guidance, published January 5, 2026, effectively exempts US-parented MNEs and their foreign subsidiaries from the Income Inclusion Rule (IIR) and Undertaxed Payments Rule (UTPR) while preserving the 15% global minimum tax for all other in-scope groups.
The New Safe Harbours
The package introduces distinct safe harbour mechanisms that will materially reduce compliance burdens for MNEs that qualify:
Simplified ETR Safe Harbour: A permanent mechanism replacing the transitional CbCR safe harbour, allowing MNEs to demonstrate compliance using simplified data rather than full GloBE calculations.
UPE Safe Harbour: Effective from January 1, 2026, this replaces the transitional UTPR safe harbour (which expired at end-2025) and deems top-up tax for the Ultimate Parent Entity's jurisdiction to be zero under the UTPR where a "qualified UPE regime" is in place.
Two additional operational safe harbours targeting specific structural and reporting challenges identified during the first years of Pillar Two implementation.
Implications for Transfer Pricing Documentation
For transfer pricing practitioners, the intersection of Pillar Two with existing TP rules creates a dual-layer compliance obligation. MNEs must now ensure that intercompany pricing not only satisfies the arm's length standard in each jurisdiction but does not inadvertently suppress the effective tax rate below 15%, triggering top-up taxes under GloBE.
Critical - The SbS package notes that none of its rules affect years 2024 and 2025. MNE groups should continue their Pillar Two compliance activities for those prior years as originally planned. Certain SbS rules may have retroactive effect only from January 1, 2026.
What MNEs Should Do Now
Tax teams should conduct a full Pillar Two impact assessment specific to their transfer pricing methodology, model the effect of the simplified ETR safe harbour on their entity-level calculations, and engage proactively with jurisdictions that have enacted domestic minimum taxes to understand how local Qualified Domestic Minimum Top-Up Taxes (QDMTTs) interact with their TP positions. The transitional CbCR safe harbour, previously set to expire at end-2026, has been extended by one year providing additional runway for groups still building their compliance infrastructure.
When the United States President signed the White House memorandum on January 20, 2025, withdrawing the United States from the OECD's global tax deal, many observers feared the entire Pillar Two edifice would collapse. Eleven months later, the OECD delivered its answer: an 88-page guidance package that introduces four new safe harbours, extends the transitional Country-by-Country Reporting (CbCR) safe harbour, and formalises the "Side-by-Side" (SbS) system agreed by the G7 and the US on June 28, 2025.
The SbS guidance, published January 5, 2026, effectively exempts US-parented MNEs and their foreign subsidiaries from the Income Inclusion Rule (IIR) and Undertaxed Payments Rule (UTPR) while preserving the 15% global minimum tax for all other in-scope groups.
The New Safe Harbours
The package introduces distinct safe harbour mechanisms that will materially reduce compliance burdens for MNEs that qualify:
Simplified ETR Safe Harbour: A permanent mechanism replacing the transitional CbCR safe harbour, allowing MNEs to demonstrate compliance using simplified data rather than full GloBE calculations.
UPE Safe Harbour: Effective from January 1, 2026, this replaces the transitional UTPR safe harbour (which expired at end-2025) and deems top-up tax for the Ultimate Parent Entity's jurisdiction to be zero under the UTPR where a "qualified UPE regime" is in place.
Two additional operational safe harbours targeting specific structural and reporting challenges identified during the first years of Pillar Two implementation.
Implications for Transfer Pricing Documentation
For transfer pricing practitioners, the intersection of Pillar Two with existing TP rules creates a dual-layer compliance obligation. MNEs must now ensure that intercompany pricing not only satisfies the arm's length standard in each jurisdiction but does not inadvertently suppress the effective tax rate below 15%, triggering top-up taxes under GloBE.
Critical - The SbS package notes that none of its rules affect years 2024 and 2025. MNE groups should continue their Pillar Two compliance activities for those prior years as originally planned. Certain SbS rules may have retroactive effect only from January 1, 2026.
What MNEs Should Do Now
Tax teams should conduct a full Pillar Two impact assessment specific to their transfer pricing methodology, model the effect of the simplified ETR safe harbour on their entity-level calculations, and engage proactively with jurisdictions that have enacted domestic minimum taxes to understand how local Qualified Domestic Minimum Top-Up Taxes (QDMTTs) interact with their TP positions. The transitional CbCR safe harbour, previously set to expire at end-2026, has been extended by one year providing additional runway for groups still building their compliance infrastructure.
Read More

New Trends in Transfer Pricing: Intangibles and Simplified Distribution Rules
New Trends in Transfer Pricing: Intangibles and Simplified Distribution Rules
Introduction
Transfer pricing has evolved beyond traditional transactions. The latest OECD Country Profiles reveal how jurisdictions are approaching hard-to-value intangibles and simplified distribution activities - two areas of increasing importance.
Hard-to-Value Intangibles (HTVI)
Intangibles such as patents, trademarks and proprietary technology pose valuation challenges. OECD Country Profiles now include how countries treat HTVI in their legislation, reflecting work under the OECD/G20 BEPS framework.
Simplified Distribution Rules
Routine distribution and marketing activities often generate low economic value yet incur compliance costs. The updated profiles identify which jurisdictions allow streamlined approaches for such “baseline” functions, reducing administrative burden without compromising compliance.
Why These Trends Matter
More predictable outcomes for intangible valuations
Reduced compliance cost for routine distribution functions
Greater alignment with international BEPS-related transfer pricing work
Conclusion
These trends show how transfer pricing rules are adapting to modern business complexity. For MNEs and advisors, staying updated on such practices, via OECD’s Country Profiles is key to pragmatic transfer pricing strategies.
Introduction
Transfer pricing has evolved beyond traditional transactions. The latest OECD Country Profiles reveal how jurisdictions are approaching hard-to-value intangibles and simplified distribution activities - two areas of increasing importance.
Hard-to-Value Intangibles (HTVI)
Intangibles such as patents, trademarks and proprietary technology pose valuation challenges. OECD Country Profiles now include how countries treat HTVI in their legislation, reflecting work under the OECD/G20 BEPS framework.
Simplified Distribution Rules
Routine distribution and marketing activities often generate low economic value yet incur compliance costs. The updated profiles identify which jurisdictions allow streamlined approaches for such “baseline” functions, reducing administrative burden without compromising compliance.
Why These Trends Matter
More predictable outcomes for intangible valuations
Reduced compliance cost for routine distribution functions
Greater alignment with international BEPS-related transfer pricing work
Conclusion
These trends show how transfer pricing rules are adapting to modern business complexity. For MNEs and advisors, staying updated on such practices, via OECD’s Country Profiles is key to pragmatic transfer pricing strategies.
Read More

Key Transfer Pricing Principles Explained Through OECD Country Profiles
Key Transfer Pricing Principles Explained Through OECD Country Profiles
Introduction
At the heart of international transfer pricing is a set of core principles and methods recognized across jurisdictions. The OECD Country Profiles distil these fundamentals and show how different countries implement them.
The Arm’s-Length Principle
This foundational concept requires related parties to price transactions as independent entities would. Nearly all country profiles anchor their systems to this principle, following the OECD Guidelines.
Accepted Transfer Pricing Methods
Countries typically recognise:
Comparable Uncontrolled Price (CUP)
Resale Price Method
Cost-Plus Method
Transactional Net Margin Method
Profit Split Method
Profiles indicate which methods are preferred or mandated locally.
Documentation & Compliance
Most jurisdictions require contemporaneous documentation demonstrating transfer pricing analysis, benchmarking, economic justification and functional analysis, mirroring OECD-derived standards.
Conclusion
For multinational enterprises, mastering these key principles through the lens of OECD Country Profiles enhances transfer pricing compliance and reduces audit risk, especially in complex, multi-jurisdictional scenarios.
Introduction
At the heart of international transfer pricing is a set of core principles and methods recognized across jurisdictions. The OECD Country Profiles distil these fundamentals and show how different countries implement them.
The Arm’s-Length Principle
This foundational concept requires related parties to price transactions as independent entities would. Nearly all country profiles anchor their systems to this principle, following the OECD Guidelines.
Accepted Transfer Pricing Methods
Countries typically recognise:
Comparable Uncontrolled Price (CUP)
Resale Price Method
Cost-Plus Method
Transactional Net Margin Method
Profit Split Method
Profiles indicate which methods are preferred or mandated locally.
Documentation & Compliance
Most jurisdictions require contemporaneous documentation demonstrating transfer pricing analysis, benchmarking, economic justification and functional analysis, mirroring OECD-derived standards.
Conclusion
For multinational enterprises, mastering these key principles through the lens of OECD Country Profiles enhances transfer pricing compliance and reduces audit risk, especially in complex, multi-jurisdictional scenarios.
Read More

What Are OECD Transfer Pricing Country Profiles & Why They Matter in 2026
What Are OECD Transfer Pricing Country Profiles & Why They Matter in 2026
Introduction
Understanding global transfer pricing trends is critical for multinationals navigating cross-border tax compliance and planning. The OECD Transfer Pricing Country Profiles provide an authoritative snapshot of how jurisdictions implement key transfer pricing rules and principles internationally.
What the Country Profiles Include
The OECD Country Profiles summarize domestic laws and practices on core transfer pricing areas:
Application of the arm’s-length principle
Recognised transfer pricing methods and comparability analysis
Treatment of intangibles and intra-group services
Documentation requirements
Approaches to disputes and safe harbours
These profiles help businesses see how local rules align with the OECD Transfer Pricing Guidelines.
Why These Profiles Are Important
Clarity & consistency: They offer a jurisdiction-by-jurisdiction breakdown, useful in compliance and planning.
Benchmarking: Tax professionals can compare how countries treat key concepts like cost contribution agreements or intra-group services.
Practical insights: Administrations often use OECD-aligned practices, but each jurisdiction has nuances, knowing them reduces audit risk.
Conclusion
The OECD Transfer Pricing Country Profiles are a high-value, practical resource for transfer pricing practitioners, multinational tax teams, and advisors aiming to understand how countries interpret and enforce transfer pricing principles in 2026.
Introduction
Understanding global transfer pricing trends is critical for multinationals navigating cross-border tax compliance and planning. The OECD Transfer Pricing Country Profiles provide an authoritative snapshot of how jurisdictions implement key transfer pricing rules and principles internationally.
What the Country Profiles Include
The OECD Country Profiles summarize domestic laws and practices on core transfer pricing areas:
Application of the arm’s-length principle
Recognised transfer pricing methods and comparability analysis
Treatment of intangibles and intra-group services
Documentation requirements
Approaches to disputes and safe harbours
These profiles help businesses see how local rules align with the OECD Transfer Pricing Guidelines.
Why These Profiles Are Important
Clarity & consistency: They offer a jurisdiction-by-jurisdiction breakdown, useful in compliance and planning.
Benchmarking: Tax professionals can compare how countries treat key concepts like cost contribution agreements or intra-group services.
Practical insights: Administrations often use OECD-aligned practices, but each jurisdiction has nuances, knowing them reduces audit risk.
Conclusion
The OECD Transfer Pricing Country Profiles are a high-value, practical resource for transfer pricing practitioners, multinational tax teams, and advisors aiming to understand how countries interpret and enforce transfer pricing principles in 2026.
Read More

Understanding the OECD Transfer Pricing Guidelines: A Global Benchmark
Understanding the OECD Transfer Pricing Guidelines: A Global Benchmark
Introduction
In an increasingly globalized economy, multinational enterprises (MNEs) conduct business across various jurisdictions. This often involves intercompany transactions that must be priced fairly to ensure tax compliance in each country. The OECD Transfer Pricing Guidelines provide a globally accepted framework to manage such intercompany pricing practices, ensuring that profits are taxed where economic activities generating them are performed.
The Role of OECD in Transfer Pricing
The Organization for Economic Co-operation and Development (OECD) has long been at the forefront of promoting international tax standards. Its Transfer Pricing Guidelines serve as a benchmark for aligning transfer pricing outcomes with value creation. Many tax jurisdictions, including India, have adopted these principles into their domestic regulations.
Key Principles
Arm's Length Principle (ALP): The foundational concept which dictates that intercompany transactions should be priced as if they were between unrelated parties.
Comparability Analysis: Determining comparable's to test the arm's length nature of a transaction.
Selection of the Most Appropriate Method: CUP, RPM, CPM, TNMM, or Profit Split.
Functional Analysis: Analyzing the functions performed, assets used, and risks assumed (FAR) by each party.
Impact on MNEs and Tax Authorities
MNEs use the guidelines to manage their transfer pricing risks and ensure compliance, while tax authorities use them to assess and verify arm's length pricing. The OECD’s work on BEPS (Base Erosion and Profit Shifting) has further strengthened these rules to prevent artificial profit shifting.
India’s Alignment with OECD
India follows OECD guidelines in principle, but there are some variations, especially in dispute resolution and documentation thresholds. However, the arm’s length principle, accepted methods, and the emphasis on economic substance are consistent with OECD standards.
Conclusion
The OECD Transfer Pricing Guidelines continue to serve as a vital tool for both taxpayers and tax administrators. Understanding and applying these guidelines is essential for any multinational operating across borders.
Introduction
In an increasingly globalized economy, multinational enterprises (MNEs) conduct business across various jurisdictions. This often involves intercompany transactions that must be priced fairly to ensure tax compliance in each country. The OECD Transfer Pricing Guidelines provide a globally accepted framework to manage such intercompany pricing practices, ensuring that profits are taxed where economic activities generating them are performed.
The Role of OECD in Transfer Pricing
The Organization for Economic Co-operation and Development (OECD) has long been at the forefront of promoting international tax standards. Its Transfer Pricing Guidelines serve as a benchmark for aligning transfer pricing outcomes with value creation. Many tax jurisdictions, including India, have adopted these principles into their domestic regulations.
Key Principles
Arm's Length Principle (ALP): The foundational concept which dictates that intercompany transactions should be priced as if they were between unrelated parties.
Comparability Analysis: Determining comparable's to test the arm's length nature of a transaction.
Selection of the Most Appropriate Method: CUP, RPM, CPM, TNMM, or Profit Split.
Functional Analysis: Analyzing the functions performed, assets used, and risks assumed (FAR) by each party.
Impact on MNEs and Tax Authorities
MNEs use the guidelines to manage their transfer pricing risks and ensure compliance, while tax authorities use them to assess and verify arm's length pricing. The OECD’s work on BEPS (Base Erosion and Profit Shifting) has further strengthened these rules to prevent artificial profit shifting.
India’s Alignment with OECD
India follows OECD guidelines in principle, but there are some variations, especially in dispute resolution and documentation thresholds. However, the arm’s length principle, accepted methods, and the emphasis on economic substance are consistent with OECD standards.
Conclusion
The OECD Transfer Pricing Guidelines continue to serve as a vital tool for both taxpayers and tax administrators. Understanding and applying these guidelines is essential for any multinational operating across borders.
Read More

Transfer Pricing in Denmark: 2025 Legislative Changes and Implications
Transfer Pricing in Denmark: 2025 Legislative Changes and Implications
A major feature of the reform is the introduction of de minimis thresholds for Transfer Pricing Documentation. Companies with total controlled transactions under DKK 5 million per year are now exempt from preparing formal documentation. This measure significantly reduces the compliance burden for businesses with limited intra-group activity.
However, this exemption does not apply to:
Transactions involving intangible assets such as royalties or intellectual property.
Dealings with related parties in non-EEA countries that lack a double tax treaty with Denmark.
In these cases, full documentation is required regardless of the transaction size.
Additionally, companies with intra-group receivables and payables below DKK 50 million can benefit from the exemption.
Higher Small Group Thresholds: Broader Eligibility for Relief
The financial thresholds that define a small group have been increased:
Turnover threshold: from DKK 250 million to DKK 391 million
Balance sheet total: from DKK 125 million to DKK 195 million
Employee threshold: remains at fewer than 250 full-time employees
This change allows more groups to qualify for documentation exemptions, offering relief to a wider range of companies.
Documentation Requirements That Continue to Apply
While the new rules provide relief for many, certain documentation obligations remain in force:
Groups with 250 or more employees must still prepare transfer pricing documentation, regardless of turnover or balance sheet totals.
Transactions involving intangible assets or dealings with related parties in non-EEA, non-treaty jurisdictions must always be documented.
The Danish Tax Agency continues to focus on high-risk areas such as intra-group loans, restructurings, and supply chain adjustments.
Simplified Compliance Processes
The reforms also simplify compliance in several ways:
The requirement for auditor statements in connection with transfer pricing documentation has been abolished. This removes a significant administrative step.
Transfer pricing documentation deadlines will now automatically align with extensions granted for the corporate income tax return. This means companies no longer need to apply separately for deadline extensions.
Implications for Businesses
These changes are expected to benefit around 1,500 companies in Denmark, primarily small and medium-sized enterprises (SMEs). SMEs with limited intra-group dealings will find compliance simpler and less costly.
For larger companies, or those involved in complex or high-risk transactions, documentation requirements remain unchanged. These businesses should expect continued scrutiny from the Danish Tax Agency, particularly for transactions involving intangibles, financial arrangements, and cross-border restructuring.
Even where exemptions apply, companies are advised to maintain internal records that demonstrate arm’s-length pricing. This precaution can help defend positions during any future audit.
Strategic Considerations
Businesses should review their operations to ensure they take advantage of the new thresholds while remaining compliant. Recommended actions include:
Assess eligibility for exemptions based on new limits.
Review intra-group transactions to identify any that still require documentation.
Update compliance calendars to reflect the automatic deadline alignment.
Strengthen internal policies to support arm’s-length pricing, even for exempt transactions.
Conclusion
The transfer pricing reforms introduced in Denmark from 3 June 2025 mark a shift towards more proportionate compliance obligations. While the rules ease the burden for smaller businesses, they reinforce the importance of robust policies and documentation for complex or higher-risk transactions. Companies should review their structures, processes, and records to ensure compliance and mitigate tax risks under the updated regime.
A major feature of the reform is the introduction of de minimis thresholds for Transfer Pricing Documentation. Companies with total controlled transactions under DKK 5 million per year are now exempt from preparing formal documentation. This measure significantly reduces the compliance burden for businesses with limited intra-group activity.
However, this exemption does not apply to:
Transactions involving intangible assets such as royalties or intellectual property.
Dealings with related parties in non-EEA countries that lack a double tax treaty with Denmark.
In these cases, full documentation is required regardless of the transaction size.
Additionally, companies with intra-group receivables and payables below DKK 50 million can benefit from the exemption.
Higher Small Group Thresholds: Broader Eligibility for Relief
The financial thresholds that define a small group have been increased:
Turnover threshold: from DKK 250 million to DKK 391 million
Balance sheet total: from DKK 125 million to DKK 195 million
Employee threshold: remains at fewer than 250 full-time employees
This change allows more groups to qualify for documentation exemptions, offering relief to a wider range of companies.
Documentation Requirements That Continue to Apply
While the new rules provide relief for many, certain documentation obligations remain in force:
Groups with 250 or more employees must still prepare transfer pricing documentation, regardless of turnover or balance sheet totals.
Transactions involving intangible assets or dealings with related parties in non-EEA, non-treaty jurisdictions must always be documented.
The Danish Tax Agency continues to focus on high-risk areas such as intra-group loans, restructurings, and supply chain adjustments.
Simplified Compliance Processes
The reforms also simplify compliance in several ways:
The requirement for auditor statements in connection with transfer pricing documentation has been abolished. This removes a significant administrative step.
Transfer pricing documentation deadlines will now automatically align with extensions granted for the corporate income tax return. This means companies no longer need to apply separately for deadline extensions.
Implications for Businesses
These changes are expected to benefit around 1,500 companies in Denmark, primarily small and medium-sized enterprises (SMEs). SMEs with limited intra-group dealings will find compliance simpler and less costly.
For larger companies, or those involved in complex or high-risk transactions, documentation requirements remain unchanged. These businesses should expect continued scrutiny from the Danish Tax Agency, particularly for transactions involving intangibles, financial arrangements, and cross-border restructuring.
Even where exemptions apply, companies are advised to maintain internal records that demonstrate arm’s-length pricing. This precaution can help defend positions during any future audit.
Strategic Considerations
Businesses should review their operations to ensure they take advantage of the new thresholds while remaining compliant. Recommended actions include:
Assess eligibility for exemptions based on new limits.
Review intra-group transactions to identify any that still require documentation.
Update compliance calendars to reflect the automatic deadline alignment.
Strengthen internal policies to support arm’s-length pricing, even for exempt transactions.
Conclusion
The transfer pricing reforms introduced in Denmark from 3 June 2025 mark a shift towards more proportionate compliance obligations. While the rules ease the burden for smaller businesses, they reinforce the importance of robust policies and documentation for complex or higher-risk transactions. Companies should review their structures, processes, and records to ensure compliance and mitigate tax risks under the updated regime.
Read More

Practical Challenges and Solutions in Transfer Pricing Benchmarking
Practical Challenges and Solutions in Transfer Pricing Benchmarking
Introduction
Despite being a technical process, benchmarking can be more art than science. Here we discuss the practical hurdles and how to overcome them.
Challenges
Lack of data on comparable companies in niche sectors
Highly integrated or bundled transactions
Transactions involving intangibles or intra-group services
Dispute over use of filters or selection criteria
Tax authority rejection of economic adjustments
Solutions
Use of industry insights and expert judgment
Supplementing with internal comparables wherever possible
Justifying use of regional / global comparables in absence of local data
Transparent documentation of all assumptions and filters
Seeking APAs to avoid prolonged litigation
Conclusion
Benchmarking is not just a mechanical process it’s a strategic. A defensible, well-documented benchmarking study can save years of dispute and litigation.
Introduction
Despite being a technical process, benchmarking can be more art than science. Here we discuss the practical hurdles and how to overcome them.
Challenges
Lack of data on comparable companies in niche sectors
Highly integrated or bundled transactions
Transactions involving intangibles or intra-group services
Dispute over use of filters or selection criteria
Tax authority rejection of economic adjustments
Solutions
Use of industry insights and expert judgment
Supplementing with internal comparables wherever possible
Justifying use of regional / global comparables in absence of local data
Transparent documentation of all assumptions and filters
Seeking APAs to avoid prolonged litigation
Conclusion
Benchmarking is not just a mechanical process it’s a strategic. A defensible, well-documented benchmarking study can save years of dispute and litigation.
Read More

Amount B – Simplifying Transfer Pricing for Distributors
Amount B – Simplifying Transfer Pricing for Distributors
Introduction
As part of the OECD’s Two-Pillar solution to address the challenges of digitalization in taxation, Pillar One’s “Amount B” aims to simplify transfer pricing for baseline marketing and distribution activities. It introduces a fixed return framework for distributors performing routine functions in their local markets.
What is Amount B?
Amount B provides a standard return for “baseline” distributors—those that do not own significant intangibles or bear substantial risks. The goal is to reduce disputes and compliance costs, especially in low-capacity jurisdictions.
Key Features
Scope: Applies to routine wholesale distributors of tangible goods.
Return: Provides a fixed operating margin (adjusted for industry and region).
Eligibility: Based on qualifying criteria including FAR analysis and documentation.
Safe Harbour Mechanism: Simplifies audit scrutiny for taxpayers who elect to apply Amount B.
Benefits of Amount B
Minimizes subjectivity in determining margins
Reduces the burden of full-fledged benchmarking
Enhances predictability and reduces audits
Adoption and Global Landscape
Several jurisdictions have signalled support for Amount B.
Countries with limited data or comparables find it especially helpful.
It may become an optional safe harbour or a mandatory method depending on jurisdiction.
Relevance for Indian Taxpayers
India has not officially adopted Amount B but is closely watching OECD developments.
For eligible taxpayers, it may offer relief where benchmarking data is weak or disputed.
It could potentially align with India’s domestic safe harbour provisions in the future.
Conclusion
Amount B is a game-changer in transfer pricing compliance. For companies engaged in routine distribution, this framework promises certainty, simplicity, and alignment with international best practices. Taxpayers should track local adoption and assess eligibility for future implementation.
Introduction
As part of the OECD’s Two-Pillar solution to address the challenges of digitalization in taxation, Pillar One’s “Amount B” aims to simplify transfer pricing for baseline marketing and distribution activities. It introduces a fixed return framework for distributors performing routine functions in their local markets.
What is Amount B?
Amount B provides a standard return for “baseline” distributors—those that do not own significant intangibles or bear substantial risks. The goal is to reduce disputes and compliance costs, especially in low-capacity jurisdictions.
Key Features
Scope: Applies to routine wholesale distributors of tangible goods.
Return: Provides a fixed operating margin (adjusted for industry and region).
Eligibility: Based on qualifying criteria including FAR analysis and documentation.
Safe Harbour Mechanism: Simplifies audit scrutiny for taxpayers who elect to apply Amount B.
Benefits of Amount B
Minimizes subjectivity in determining margins
Reduces the burden of full-fledged benchmarking
Enhances predictability and reduces audits
Adoption and Global Landscape
Several jurisdictions have signalled support for Amount B.
Countries with limited data or comparables find it especially helpful.
It may become an optional safe harbour or a mandatory method depending on jurisdiction.
Relevance for Indian Taxpayers
India has not officially adopted Amount B but is closely watching OECD developments.
For eligible taxpayers, it may offer relief where benchmarking data is weak or disputed.
It could potentially align with India’s domestic safe harbour provisions in the future.
Conclusion
Amount B is a game-changer in transfer pricing compliance. For companies engaged in routine distribution, this framework promises certainty, simplicity, and alignment with international best practices. Taxpayers should track local adoption and assess eligibility for future implementation.
Read More

Transfer Pricing in the United Kingdom: Transparency and Risk-Based Scrutiny
Transfer Pricing in the United Kingdom: Transparency and Risk-Based Scrutiny
Introduction
The UK follows OECD Guidelines and maintains a risk-based approach to enforcement. HMRC emphasizes strategic risk classification and cooperative compliance via the Business Risk Review (BRR+).
Key Features
Legislation: Based on the Taxes Act 2010; fully aligned with OECD BEPS.
Documentation: Master and local file required; country-specific details expected.
CbCR: Mandatory for large MNEs; shared through treaty networks.
APAs and MAPs: Available, with early engagement and bilateral scope prioritized.
Current Developments
High scrutiny on intangibles, intragroup services, and financial arrangements.
Supportive of Pillar One and Pillar Two adoption by 2025.
Alignment with EU’s public CbCR regulations.
Conclusion
TP in the UK is shifting toward proactive transparency. MNEs should embrace documentation best practices, anticipate audit triggers, and align closely with OECD interpretations.
Introduction
The UK follows OECD Guidelines and maintains a risk-based approach to enforcement. HMRC emphasizes strategic risk classification and cooperative compliance via the Business Risk Review (BRR+).
Key Features
Legislation: Based on the Taxes Act 2010; fully aligned with OECD BEPS.
Documentation: Master and local file required; country-specific details expected.
CbCR: Mandatory for large MNEs; shared through treaty networks.
APAs and MAPs: Available, with early engagement and bilateral scope prioritized.
Current Developments
High scrutiny on intangibles, intragroup services, and financial arrangements.
Supportive of Pillar One and Pillar Two adoption by 2025.
Alignment with EU’s public CbCR regulations.
Conclusion
TP in the UK is shifting toward proactive transparency. MNEs should embrace documentation best practices, anticipate audit triggers, and align closely with OECD interpretations.
Read More

Transfer Pricing Benchmarking: An Indian Perspective
Transfer Pricing Benchmarking: An Indian Perspective
Introduction
Benchmarking is the backbone of any credible transfer pricing analysis. In India, where the Income Tax Act, 1961 and associated rules closely mirror OECD guidelines, benchmarking is crucial for validating that international transactions are at arm’s length.
Benchmarking in the Indian Context
Regulatory framework: Section 92C and Rule 10B of the Income Tax Rules
Requirement to use Indian database (e.g., Prowess, Capitaline) for local comparables
Preference for current year data and filters mandated by Indian TP audit practices
Concept of “tested party” and “most appropriate method”
Step-by-Step Process
Functional and risk profile analysis (FAR)
Selection of tested party and method
Use of database for comparable search
Applying quantitative filters (e.g., turnover, employee cost, export filter)
Computation of average margins and arm’s length range
Indian Tax Authority’s Expectations
Justification of each filter used
Use of multiple year data only if current year data is unavailable
Challenges with cherry-picking comparables or rejecting loss-making companies
Conclusion
In India, benchmarking must be technically sound and meticulously documented. The local tax authority takes a strict view on selection of comparables and expects robust economic reasoning.
Introduction
Benchmarking is the backbone of any credible transfer pricing analysis. In India, where the Income Tax Act, 1961 and associated rules closely mirror OECD guidelines, benchmarking is crucial for validating that international transactions are at arm’s length.
Benchmarking in the Indian Context
Regulatory framework: Section 92C and Rule 10B of the Income Tax Rules
Requirement to use Indian database (e.g., Prowess, Capitaline) for local comparables
Preference for current year data and filters mandated by Indian TP audit practices
Concept of “tested party” and “most appropriate method”
Step-by-Step Process
Functional and risk profile analysis (FAR)
Selection of tested party and method
Use of database for comparable search
Applying quantitative filters (e.g., turnover, employee cost, export filter)
Computation of average margins and arm’s length range
Indian Tax Authority’s Expectations
Justification of each filter used
Use of multiple year data only if current year data is unavailable
Challenges with cherry-picking comparables or rejecting loss-making companies
Conclusion
In India, benchmarking must be technically sound and meticulously documented. The local tax authority takes a strict view on selection of comparables and expects robust economic reasoning.
Read More

Pillar One and Pillar Two - OECD’s Global Tax Reform and its TP Implications
Pillar One and Pillar Two - OECD’s Global Tax Reform and its TP Implications
Introduction
The OECD/G20 Inclusive Framework’s two-pillar solution addresses the tax challenges of digitalization and profit shifting. It represents a monumental shift in global taxation, directly affecting transfer pricing norms.
Pillar One: Reallocation of Profits
Focuses on reallocating taxing rights for large, highly digitalized MNEs (Group revenue > €20 billion).
Amount A reallocates a portion of residual profits to market jurisdictions.
Amount B (as covered earlier) provides a standardized return for baseline marketing and distribution.
Pillar Two: Global Minimum Tax
Introduces a 15% global minimum effective tax rate for MNEs with revenue over €750 million.
Applies through Income Inclusion Rule (IIR) and Undertaxed Payments Rule (UTPR).
TP policies may require adjustment to ensure alignment with minimum tax thresholds.
TP Implications
Less room for aggressive profit shifting through low-tax jurisdictions.
Greater emphasis on accurate profit attribution based on substance.
Multinational groups may need to review existing TP models to meet Pillar Two compliance.
Conclusion
Pillars One and Two reshape the global tax landscape. MNEs must proactively assess their TP and group structures to stay aligned with these sweeping changes.
Introduction
The OECD/G20 Inclusive Framework’s two-pillar solution addresses the tax challenges of digitalization and profit shifting. It represents a monumental shift in global taxation, directly affecting transfer pricing norms.
Pillar One: Reallocation of Profits
Focuses on reallocating taxing rights for large, highly digitalized MNEs (Group revenue > €20 billion).
Amount A reallocates a portion of residual profits to market jurisdictions.
Amount B (as covered earlier) provides a standardized return for baseline marketing and distribution.
Pillar Two: Global Minimum Tax
Introduces a 15% global minimum effective tax rate for MNEs with revenue over €750 million.
Applies through Income Inclusion Rule (IIR) and Undertaxed Payments Rule (UTPR).
TP policies may require adjustment to ensure alignment with minimum tax thresholds.
TP Implications
Less room for aggressive profit shifting through low-tax jurisdictions.
Greater emphasis on accurate profit attribution based on substance.
Multinational groups may need to review existing TP models to meet Pillar Two compliance.
Conclusion
Pillars One and Two reshape the global tax landscape. MNEs must proactively assess their TP and group structures to stay aligned with these sweeping changes.
Read More

Transfer Pricing for Intangibles: OECD’s Guidance and Practical Implications
Transfer Pricing for Intangibles: OECD’s Guidance and Practical Implications
Introduction
In the modern economy, intangibles such as intellectual property, brands, technology, and know-how play a central role in value creation for multinational enterprises (MNEs). However, pricing transactions involving intangibles poses significant challenges for both taxpayers and tax authorities. The OECD has issued extensive guidance to bring clarity and consistency to this complex area.
What are Intangibles?
According to the OECD, intangibles are assets that are not physical or financial in nature but have value because they can generate income or provide economic benefit. Examples include patents, trademarks, copyrights, proprietary processes, customer lists, and software.
Challenges in Transfer Pricing for Intangibles
Lack of comparable uncontrolled transactions
Difficulty in valuing unique intangibles
Allocation of income among group entities
Determining who owns and controls the intangible
DEMPE Analysis: OECD’s Framework
The OECD emphasizes the need to analyze the Development, Enhancement, Maintenance, Protection, and Exploitation (DEMPE) functions related to intangibles. The entity performing these functions—and bearing the associated risks—should be entitled to the returns.
Steps in Conducting DEMPE Analysis
Identify relevant intangibles and the parties involved
Analyze each party’s contribution to DEMPE functions
Examine the contractual arrangements and align them with actual conduct
Determine the appropriate return based on value creation
Valuation Methods While traditional methods (CUP, CPM, TNMM) may still apply, intangibles often require the use of:
Income-based approaches (e.g., discounted cash flow)
Valuation models like profit split or residual profit split
Hard-to-Value Intangibles (HTVI)
OECD has introduced specific guidance for HTVIs—intangibles for which no reliable comparables exist and future projections are highly uncertain. Tax authorities are allowed to use ex-post outcomes to adjust transfer prices, subject to safeguards.
India’s Approach
India largely aligns with OECD’s approach on intangibles and emphasizes substance over form. Indian tax authorities scrutinize royalty payments, cost-sharing arrangements, and DEMPE analyses in detail.
Conclusion
Pricing transactions involving intangibles is a high-risk area in transfer pricing. MNEs must document and substantiate their DEMPE functions and valuation methodologies thoroughly to defend their positions during audits.
Introduction
In the modern economy, intangibles such as intellectual property, brands, technology, and know-how play a central role in value creation for multinational enterprises (MNEs). However, pricing transactions involving intangibles poses significant challenges for both taxpayers and tax authorities. The OECD has issued extensive guidance to bring clarity and consistency to this complex area.
What are Intangibles?
According to the OECD, intangibles are assets that are not physical or financial in nature but have value because they can generate income or provide economic benefit. Examples include patents, trademarks, copyrights, proprietary processes, customer lists, and software.
Challenges in Transfer Pricing for Intangibles
Lack of comparable uncontrolled transactions
Difficulty in valuing unique intangibles
Allocation of income among group entities
Determining who owns and controls the intangible
DEMPE Analysis: OECD’s Framework
The OECD emphasizes the need to analyze the Development, Enhancement, Maintenance, Protection, and Exploitation (DEMPE) functions related to intangibles. The entity performing these functions—and bearing the associated risks—should be entitled to the returns.
Steps in Conducting DEMPE Analysis
Identify relevant intangibles and the parties involved
Analyze each party’s contribution to DEMPE functions
Examine the contractual arrangements and align them with actual conduct
Determine the appropriate return based on value creation
Valuation Methods While traditional methods (CUP, CPM, TNMM) may still apply, intangibles often require the use of:
Income-based approaches (e.g., discounted cash flow)
Valuation models like profit split or residual profit split
Hard-to-Value Intangibles (HTVI)
OECD has introduced specific guidance for HTVIs—intangibles for which no reliable comparables exist and future projections are highly uncertain. Tax authorities are allowed to use ex-post outcomes to adjust transfer prices, subject to safeguards.
India’s Approach
India largely aligns with OECD’s approach on intangibles and emphasizes substance over form. Indian tax authorities scrutinize royalty payments, cost-sharing arrangements, and DEMPE analyses in detail.
Conclusion
Pricing transactions involving intangibles is a high-risk area in transfer pricing. MNEs must document and substantiate their DEMPE functions and valuation methodologies thoroughly to defend their positions during audits.
Read More

Transfer Pricing in the United States: Focus on Substance and Enforcement
Transfer Pricing in the United States: Focus on Substance and Enforcement
Introduction
The United States has one of the most developed transfer pricing regimes in the world, governed by Internal Revenue Code Section 482 and detailed Treasury Regulations. The IRS plays a leading role in global transfer pricing discourse, especially on high-value intangibles, cost-sharing arrangements, and APAs.
Key Features
Regulatory Authority: Section 482 of the IRC, with extensive Treasury Regulations.
APAs and MAPs: The Advance Pricing and Mutual Agreement (APMA) Program is one of the most active globally.
Documentation: Though no formal master file requirement, detailed contemporaneous documentation is mandated to avoid penalties.
CbCR Filing: Through Form 8975 for MNEs with revenue over $850 million.
Current Developments
Increased focus on cost sharing and intangibles, especially post-Altera and Amazon cases.
Pillar Two alignment is ongoing, with partial overlap via GILTI and BEAT rules.
Emphasis on substance over form and economic reality in audit reviews.
Conclusion
Transfer pricing in the US requires rigorous documentation and defensible economic analysis. MNEs operating in the US should prepare for deep functional reviews and proactive engagement with the IRS.
Introduction
The United States has one of the most developed transfer pricing regimes in the world, governed by Internal Revenue Code Section 482 and detailed Treasury Regulations. The IRS plays a leading role in global transfer pricing discourse, especially on high-value intangibles, cost-sharing arrangements, and APAs.
Key Features
Regulatory Authority: Section 482 of the IRC, with extensive Treasury Regulations.
APAs and MAPs: The Advance Pricing and Mutual Agreement (APMA) Program is one of the most active globally.
Documentation: Though no formal master file requirement, detailed contemporaneous documentation is mandated to avoid penalties.
CbCR Filing: Through Form 8975 for MNEs with revenue over $850 million.
Current Developments
Increased focus on cost sharing and intangibles, especially post-Altera and Amazon cases.
Pillar Two alignment is ongoing, with partial overlap via GILTI and BEAT rules.
Emphasis on substance over form and economic reality in audit reviews.
Conclusion
Transfer pricing in the US requires rigorous documentation and defensible economic analysis. MNEs operating in the US should prepare for deep functional reviews and proactive engagement with the IRS.
Read More

Transfer Pricing Documentation: Importance, Structure & Global Expectations
Transfer Pricing Documentation: Importance, Structure & Global Expectations
In an increasingly globalized business environment, Transfer Pricing (TP) continues to be one of the most scrutinized tax issues by regulators around the world. As multinational enterprises (MNEs) operate across borders, pricing transactions between associated enterprises becomes a key area of risk. Proper Transfer Pricing Documentation (TPD) acts not only as a regulatory requirement but also as a shield against tax adjustments and penalties.
What is Transfer Pricing Documentation?
Transfer Pricing Documentation refers to the set of reports and records maintained by an enterprise to demonstrate that its related party transactions are conducted at an Arm’s Length Price (ALP) the price that would have been charged between unrelated parties in similar circumstances.
It is mandatory in most jurisdictions and serves as the primary evidence to support the enterprise's TP policies in the event of a tax audit.
Objectives of Transfer Pricing Documentation
Compliance with domestic and international regulations (such as OECD TP Guidelines).
Substantiation that the controlled transactions are at arm’s length.
Mitigation of penalties by showing reasonable efforts toward accurate pricing.
Transparency for tax authorities to assess risks in intra-group transactions.
Audit readiness by preparing consistent and defendable TP positions.
The OECD’s Three-Tiered TP Documentation Framework
As per the OECD BEPS Action Plan 13, countries have widely adopted a three-tiered documentation structure, which includes:
1. Master File
Provides a high-level overview of the MNE’s global business operations, TP policies, and value creation.
Organizational structure
Business description
Intangible assets and financing arrangements
Consolidated financials
Global TP policy
2. Local File
Focuses on specific local entity transactions and demonstrates that these are in line with ALP.
Entity-specific management and organizational structure
Detailed descriptions of related party transactions
Functional and comparability analysis
Benchmarking study
Financials of the local entity
3. Country-by-Country Report (CbCR)
Provides tax authorities with information about global allocation of income, taxes, and business activities across jurisdictions.
Threshold: Applies to MNEs with consolidated group revenue above EUR 750 million.
Importance of Maintaining TP Documentation
Risk Mitigation During Audits
Tax authorities globally are increasing TP scrutiny. Having well-prepared documentation:
Minimizes disputes and adjustments
Avoids double taxation
Demonstrates good faith and compliance
Penalty Protection
Several jurisdictions impose significant penalties for failure to maintain documentation, or for incorrect or missing filings. Good documentation can help in penalty defense.
Consistency Across Jurisdictions
The Master File and Local File together ensure consistency of positions globally, reducing the risk of tax authority mismatches.
Improved Internal Governance
Helps MNEs understand their internal pricing mechanisms and align pricing with business models and value chains.
Support for APA & MAP Applications
Robust documentation is a critical requirement for entering Advance Pricing Agreements (APA) or seeking relief under Mutual Agreement Procedures (MAP).
Conclusion
In today’s dynamic and digitalized tax environment, Transfer Pricing Documentation is not optional—it’s essential. Beyond being a regulatory mandate, it’s a proactive tool to manage tax risks, ensure consistency, and defend your transfer pricing policies under audit.
As tax authorities worldwide continue to collaborate and share data, MNEs need to prioritize high-quality, consistent, and timely TP documentation to stay ahead of the curve.
In an increasingly globalized business environment, Transfer Pricing (TP) continues to be one of the most scrutinized tax issues by regulators around the world. As multinational enterprises (MNEs) operate across borders, pricing transactions between associated enterprises becomes a key area of risk. Proper Transfer Pricing Documentation (TPD) acts not only as a regulatory requirement but also as a shield against tax adjustments and penalties.
What is Transfer Pricing Documentation?
Transfer Pricing Documentation refers to the set of reports and records maintained by an enterprise to demonstrate that its related party transactions are conducted at an Arm’s Length Price (ALP) the price that would have been charged between unrelated parties in similar circumstances.
It is mandatory in most jurisdictions and serves as the primary evidence to support the enterprise's TP policies in the event of a tax audit.
Objectives of Transfer Pricing Documentation
Compliance with domestic and international regulations (such as OECD TP Guidelines).
Substantiation that the controlled transactions are at arm’s length.
Mitigation of penalties by showing reasonable efforts toward accurate pricing.
Transparency for tax authorities to assess risks in intra-group transactions.
Audit readiness by preparing consistent and defendable TP positions.
The OECD’s Three-Tiered TP Documentation Framework
As per the OECD BEPS Action Plan 13, countries have widely adopted a three-tiered documentation structure, which includes:
1. Master File
Provides a high-level overview of the MNE’s global business operations, TP policies, and value creation.
Organizational structure
Business description
Intangible assets and financing arrangements
Consolidated financials
Global TP policy
2. Local File
Focuses on specific local entity transactions and demonstrates that these are in line with ALP.
Entity-specific management and organizational structure
Detailed descriptions of related party transactions
Functional and comparability analysis
Benchmarking study
Financials of the local entity
3. Country-by-Country Report (CbCR)
Provides tax authorities with information about global allocation of income, taxes, and business activities across jurisdictions.
Threshold: Applies to MNEs with consolidated group revenue above EUR 750 million.
Importance of Maintaining TP Documentation
Risk Mitigation During Audits
Tax authorities globally are increasing TP scrutiny. Having well-prepared documentation:
Minimizes disputes and adjustments
Avoids double taxation
Demonstrates good faith and compliance
Penalty Protection
Several jurisdictions impose significant penalties for failure to maintain documentation, or for incorrect or missing filings. Good documentation can help in penalty defense.
Consistency Across Jurisdictions
The Master File and Local File together ensure consistency of positions globally, reducing the risk of tax authority mismatches.
Improved Internal Governance
Helps MNEs understand their internal pricing mechanisms and align pricing with business models and value chains.
Support for APA & MAP Applications
Robust documentation is a critical requirement for entering Advance Pricing Agreements (APA) or seeking relief under Mutual Agreement Procedures (MAP).
Conclusion
In today’s dynamic and digitalized tax environment, Transfer Pricing Documentation is not optional—it’s essential. Beyond being a regulatory mandate, it’s a proactive tool to manage tax risks, ensure consistency, and defend your transfer pricing policies under audit.
As tax authorities worldwide continue to collaborate and share data, MNEs need to prioritize high-quality, consistent, and timely TP documentation to stay ahead of the curve.
Read More

The Arm’s Length Principle: Cornerstone of Transfer Pricing
The Arm’s Length Principle: Cornerstone of Transfer Pricing
Introduction
The arm’s length principle (ALP) is the backbone of transfer pricing regulations. It ensures that transactions between associated enterprises reflect the pricing that would be agreed upon by independent entities under comparable circumstances.
What is the Arm’s Length Principle?
ALP requires that related parties price their intercompany transactions as if they were unrelated. This ensures that profits are taxed where the actual economic activities occur.
Application of ALP
The application of ALP involves:
Identifying the controlled transaction
Conducting a functional and risk analysis
Selecting the most appropriate transfer pricing method
Performing comparability analysis
Transfer Pricing Methods Under OECD
Comparable Uncontrolled Price (CUP) Method
Resale Price Method (RPM)
Cost Plus Method (CPM)
Transactional Net Margin Method (TNMM)
Profit Split Method (PSM)
Challenges in Applying ALP
Finding appropriate comparables
Adjusting for differences in economic circumstances
Handling unique intangibles
Valuing services and financing transactions
Recent OECD Updates
Increased emphasis on economic substance
DEMPE analysis for intangibles
Application of ALP in hard-to-value intangibles and financial transactions
Conclusion
Applying the arm’s length principle correctly is crucial for managing transfer pricing risks. With increasing scrutiny from tax authorities, MNEs must ensure robust documentation and justification of their intercompany pricing.
Introduction
The arm’s length principle (ALP) is the backbone of transfer pricing regulations. It ensures that transactions between associated enterprises reflect the pricing that would be agreed upon by independent entities under comparable circumstances.
What is the Arm’s Length Principle?
ALP requires that related parties price their intercompany transactions as if they were unrelated. This ensures that profits are taxed where the actual economic activities occur.
Application of ALP
The application of ALP involves:
Identifying the controlled transaction
Conducting a functional and risk analysis
Selecting the most appropriate transfer pricing method
Performing comparability analysis
Transfer Pricing Methods Under OECD
Comparable Uncontrolled Price (CUP) Method
Resale Price Method (RPM)
Cost Plus Method (CPM)
Transactional Net Margin Method (TNMM)
Profit Split Method (PSM)
Challenges in Applying ALP
Finding appropriate comparables
Adjusting for differences in economic circumstances
Handling unique intangibles
Valuing services and financing transactions
Recent OECD Updates
Increased emphasis on economic substance
DEMPE analysis for intangibles
Application of ALP in hard-to-value intangibles and financial transactions
Conclusion
Applying the arm’s length principle correctly is crucial for managing transfer pricing risks. With increasing scrutiny from tax authorities, MNEs must ensure robust documentation and justification of their intercompany pricing.
Read More
OECD’s Three-Tiered Documentation Approach
OECD’s Three-Tiered Documentation Approach
Introduction
In response to rising concerns about base erosion and profit shifting (BEPS), the OECD introduced a standardized three-tiered documentation approach under Action 13 of the BEPS Action Plan. This documentation framework ensures that tax authorities have sufficient information to assess the transfer pricing risks and tax positions of multinational enterprises (MNEs).
Overview of the Three Tiers
Master File
Provides a high-level overview of the MNE group’s global business operations and transfer pricing policies.
Includes details such as organizational structure, description of business activities, intangibles, intercompany financial activities, and financial/TP positions.
Local File
Contains detailed information specific to the local entity’s intercompany transactions.
Must include a description of controlled transactions, entity’s management structure, FAR analysis, selection and application of transfer pricing methods, and economic analyses.
Country-by-Country Report (CbCR)
Provides aggregate tax jurisdiction-wise data on the global allocation of income, taxes paid, and certain indicators of economic activity.
Typically required for MNE groups with consolidated group revenue exceeding €750 million.
Implementation Across Jurisdictions
The three-tiered documentation requirement has been implemented in numerous countries including India, the UK, the USA, and EU member states. While the general structure remains consistent, the thresholds, filing timelines, and formats may vary.
India’s Perspective
India has fully adopted the Master File and CbCR requirements under its Income Tax Rules.
Specific forms (Form 3CEAA and 3CEAB for Master File, Form 3CEAD for CbCR) must be filed.
Thresholds: Consolidated group revenue of INR 5,000 crore for CbCR; INR 500 crore for Master File Part A; INR 50 crore for Master File Part B.
Benefits of Compliance
Enhances transparency and tax compliance
Reduces the risk of audits and penalties
Helps MNEs proactively assess and manage their global TP risks
Challenges and Best Practices
Gathering and aligning data across jurisdictions
Ensuring consistency between Master File, Local File, and CbCR
Timely preparation and filing
Using technology platforms to automate data collection and reporting
Conclusion
The OECD’s three-tiered documentation approach is a critical compliance requirement for MNEs operating in multiple countries. A proactive and consistent documentation strategy not only ensures compliance but also strengthens the MNE’s position in potential audits or disputes.
Introduction
In response to rising concerns about base erosion and profit shifting (BEPS), the OECD introduced a standardized three-tiered documentation approach under Action 13 of the BEPS Action Plan. This documentation framework ensures that tax authorities have sufficient information to assess the transfer pricing risks and tax positions of multinational enterprises (MNEs).
Overview of the Three Tiers
Master File
Provides a high-level overview of the MNE group’s global business operations and transfer pricing policies.
Includes details such as organizational structure, description of business activities, intangibles, intercompany financial activities, and financial/TP positions.
Local File
Contains detailed information specific to the local entity’s intercompany transactions.
Must include a description of controlled transactions, entity’s management structure, FAR analysis, selection and application of transfer pricing methods, and economic analyses.
Country-by-Country Report (CbCR)
Provides aggregate tax jurisdiction-wise data on the global allocation of income, taxes paid, and certain indicators of economic activity.
Typically required for MNE groups with consolidated group revenue exceeding €750 million.
Implementation Across Jurisdictions
The three-tiered documentation requirement has been implemented in numerous countries including India, the UK, the USA, and EU member states. While the general structure remains consistent, the thresholds, filing timelines, and formats may vary.
India’s Perspective
India has fully adopted the Master File and CbCR requirements under its Income Tax Rules.
Specific forms (Form 3CEAA and 3CEAB for Master File, Form 3CEAD for CbCR) must be filed.
Thresholds: Consolidated group revenue of INR 5,000 crore for CbCR; INR 500 crore for Master File Part A; INR 50 crore for Master File Part B.
Benefits of Compliance
Enhances transparency and tax compliance
Reduces the risk of audits and penalties
Helps MNEs proactively assess and manage their global TP risks
Challenges and Best Practices
Gathering and aligning data across jurisdictions
Ensuring consistency between Master File, Local File, and CbCR
Timely preparation and filing
Using technology platforms to automate data collection and reporting
Conclusion
The OECD’s three-tiered documentation approach is a critical compliance requirement for MNEs operating in multiple countries. A proactive and consistent documentation strategy not only ensures compliance but also strengthens the MNE’s position in potential audits or disputes.
Read More

Transforming Transfer Pricing Operations: A refreshed perspective
Transforming Transfer Pricing Operations: A refreshed perspective
As the financial year draws to a close, businesses often face a myriad of challenges, particularly in the realm of operational transfer pricing (OTP). Ensuring compliance with transfer pricing (TP) regulations while maintaining optimal operational efficiency can be a complex balancing act. Companies must navigate through stringent documentation requirements, fluctuating market conditions, and the need for accurate intercompany pricing adjustments.
This blog post series delves into understanding what OTP is all about, the common hurdles encountered and offers insights on how to effectively manage OTP to achieve both regulatory compliance and business objectives.
Recap on key added value of the TP function
The TP function of a multinational enterprise (MNE) is tasked with determining the intercompany prices for goods or services exchanged between affiliated legal entities. This function spans the tax, finance, and supply chain departments, focusing on setting and implementing TP policies and models. It serves as a strategic tool for allocating income and expenses among various subsidiaries across different tax jurisdictions.
To understand the perspectives we will share throughout this blog post series, we would like to share our view on the key activities and added value that a well-functioning TP operation should bring to an MNE. By setting appropriate transfer prices for intercompany transactions, TP managers play a crucial role in enhancing operational efficiency, improving profitability, and maintaining a competitive edge. Additionally, effective TP management helps mitigate the risk of audits and penalties, fostering a transparent and sustainable global financial strategy.
Understanding operational activities in managing TP
OTP processes specifically involve the operational activities that ensure TP policies are accurately represented in an organizations books and records. The activities we consider as OTP are:
P&L segmentation and margin monitoring
In the context of OTP, many legal entities within MNEs undertake more than one activity that requires to be tested from a TP perspective. P&L segmentation and margin monitoring enable MNEs to analyse their profitability across different business segments, geographies, or product lines. By segmenting the Profit and Loss (P&L) statements, companies can accurately identify and allocate revenues, costs, and profits associated with different activities which need to be tested and managed from a TP perspective. This detailed view helps ensure MNEs monitor and set the pricing of intercompany transactions to ensure the P&L outcomes are aligned with the arm's length principle, thereby enhancing compliance with international tax regulations. Margin monitoring involves the continuous assessment of these segmented profits to ensure that each entity within the multinational organisation is earning an appropriate return. This diligent process helps in identifying discrepancies, potential TP adjustments, and areas requiring documentation updates.
Adjustment calculation and processing
TP adjustment calculations and processing are vital for maintaining compliance with international tax regulations and ensuring that intercompany transactions reflect arm’s length pricing. The importance of TP adjustments lies in their ability to correct discrepancies between actual intercompany prices and those that would have been charged between independent parties under comparable conditions. The activities involved in this process include analysing financial data, comparing actual transaction prices with benchmarked arm’s length ranges, and calculating necessary adjustments to align with regulatory standards. Once calculated, these adjustments must be processed, which involves making the appropriate accounting entries, updating financial records, and thoroughly documenting the rationale for the adjustments. This process helps mitigate the risk of penalties and audits from tax authorities, ensures accurate financial reporting, and maintains the integrity of the company’s TP policies. There may also be the need to liaise with other stakeholders such as the customs team to ensure that any adjustments are also factored into other compliance obligations.
Cost allocation and intercompany charging
Cost allocation and intercompany charging are crucial processes that ensure the equitable distribution of costs among related entities within an MNE. The relevance for TP lies in the need to justify that shared costs, such as administrative expenses, R&D, and shared services, adhere to the arm's length principle and are allocated based on actual usage or benefit derived. This process involves identifying and categorizing shared costs, selecting appropriate allocation keys (e.g., headcount, revenue etc.), and applying these keys to accurately allocate costs among group entities. Intercompany charging then sets the prices for these allocated costs and initiates the actual invoicing flow. The activities include detailed cost analysis, documentation of allocation methodologies, and continuous monitoring and adjustment to reflect changes in business operations or regulatory requirements.
TP compliance management and TP documentation drafting
TP compliance management encompasses a series of activities aimed at ensuring a company meets local TP compliance obligations accurately and on time. The process begins with meticulously listing compliance obligations and deadlines.
Continuously organizing TP-relevant data is also a crucial sub-process. As deadlines approach, the preparation and filing of TP forms commence, involving the collection of data, transforming them to complete the necessary schedules, and ensuring all information is correct and complete.
Specifically, the operational aspect of drafting TP documentation is a critical component of TP compliance processes, as such documentation is essential for demonstrating compliance with international tax regulations and supporting the arm's length nature of intercompany transactions. The importance of TP documentation is widely recognised: It serves as evidence during tax audits, providing transparency and justifying the pricing methodologies applied to related-party transactions. This documentation involves compiling detailed reports that include descriptions of the business structure, industry analysis, functional and risk analysis, and economic analysis of intercompany transactions. The operational activities involved in preparing TP documentation include gathering and analysing relevant financial data, conducting comparability analyses, and substantiating the applied TP methods.
Effective TP compliance management helps mitigate the risk of penalties and legal issues, ensuring the company’s financial practices are transparent and in line with regulatory requirements.
Intercompany agreement management and maintenance
Intercompany agreement management and maintenance are essential processes that ensure the contractual terms governing transactions between related entities are transparent, consistent, and compliant with the arm's length principle. These agreements serve as formal documentation that substantiates the nature and terms of intercompany transactions for tax authorities, thereby reducing the risk of audits and penalties. The activities involved include drafting precise and comprehensive agreements that detail the pricing methodologies, payment terms, and roles and responsibilities of each party. This process also involves regularly reviewing and updating agreements to reflect changes in business operations, regulatory requirements, or market conditions. Additionally, maintaining a centralized repository for these agreements facilitates easy retrieval and reference during internal audits or tax inspections. Effective management and maintenance of intercompany agreements help ensure that all related-party transactions are legally sound, properly documented, and compliant with international TP regulations, thereby supporting the integrity and defensibility of the company’s TP strategy. Equally, ensuring that the financial commitments that are set out in the intercompany agreements are executed in line with the contractual terms is critical to ensure that the transfer pricing position is appropriately supported.
As the financial year draws to a close, businesses often face a myriad of challenges, particularly in the realm of operational transfer pricing (OTP). Ensuring compliance with transfer pricing (TP) regulations while maintaining optimal operational efficiency can be a complex balancing act. Companies must navigate through stringent documentation requirements, fluctuating market conditions, and the need for accurate intercompany pricing adjustments.
This blog post series delves into understanding what OTP is all about, the common hurdles encountered and offers insights on how to effectively manage OTP to achieve both regulatory compliance and business objectives.
Recap on key added value of the TP function
The TP function of a multinational enterprise (MNE) is tasked with determining the intercompany prices for goods or services exchanged between affiliated legal entities. This function spans the tax, finance, and supply chain departments, focusing on setting and implementing TP policies and models. It serves as a strategic tool for allocating income and expenses among various subsidiaries across different tax jurisdictions.
To understand the perspectives we will share throughout this blog post series, we would like to share our view on the key activities and added value that a well-functioning TP operation should bring to an MNE. By setting appropriate transfer prices for intercompany transactions, TP managers play a crucial role in enhancing operational efficiency, improving profitability, and maintaining a competitive edge. Additionally, effective TP management helps mitigate the risk of audits and penalties, fostering a transparent and sustainable global financial strategy.
Understanding operational activities in managing TP
OTP processes specifically involve the operational activities that ensure TP policies are accurately represented in an organizations books and records. The activities we consider as OTP are:
P&L segmentation and margin monitoring
In the context of OTP, many legal entities within MNEs undertake more than one activity that requires to be tested from a TP perspective. P&L segmentation and margin monitoring enable MNEs to analyse their profitability across different business segments, geographies, or product lines. By segmenting the Profit and Loss (P&L) statements, companies can accurately identify and allocate revenues, costs, and profits associated with different activities which need to be tested and managed from a TP perspective. This detailed view helps ensure MNEs monitor and set the pricing of intercompany transactions to ensure the P&L outcomes are aligned with the arm's length principle, thereby enhancing compliance with international tax regulations. Margin monitoring involves the continuous assessment of these segmented profits to ensure that each entity within the multinational organisation is earning an appropriate return. This diligent process helps in identifying discrepancies, potential TP adjustments, and areas requiring documentation updates.
Adjustment calculation and processing
TP adjustment calculations and processing are vital for maintaining compliance with international tax regulations and ensuring that intercompany transactions reflect arm’s length pricing. The importance of TP adjustments lies in their ability to correct discrepancies between actual intercompany prices and those that would have been charged between independent parties under comparable conditions. The activities involved in this process include analysing financial data, comparing actual transaction prices with benchmarked arm’s length ranges, and calculating necessary adjustments to align with regulatory standards. Once calculated, these adjustments must be processed, which involves making the appropriate accounting entries, updating financial records, and thoroughly documenting the rationale for the adjustments. This process helps mitigate the risk of penalties and audits from tax authorities, ensures accurate financial reporting, and maintains the integrity of the company’s TP policies. There may also be the need to liaise with other stakeholders such as the customs team to ensure that any adjustments are also factored into other compliance obligations.
Cost allocation and intercompany charging
Cost allocation and intercompany charging are crucial processes that ensure the equitable distribution of costs among related entities within an MNE. The relevance for TP lies in the need to justify that shared costs, such as administrative expenses, R&D, and shared services, adhere to the arm's length principle and are allocated based on actual usage or benefit derived. This process involves identifying and categorizing shared costs, selecting appropriate allocation keys (e.g., headcount, revenue etc.), and applying these keys to accurately allocate costs among group entities. Intercompany charging then sets the prices for these allocated costs and initiates the actual invoicing flow. The activities include detailed cost analysis, documentation of allocation methodologies, and continuous monitoring and adjustment to reflect changes in business operations or regulatory requirements.
TP compliance management and TP documentation drafting
TP compliance management encompasses a series of activities aimed at ensuring a company meets local TP compliance obligations accurately and on time. The process begins with meticulously listing compliance obligations and deadlines.
Continuously organizing TP-relevant data is also a crucial sub-process. As deadlines approach, the preparation and filing of TP forms commence, involving the collection of data, transforming them to complete the necessary schedules, and ensuring all information is correct and complete.
Specifically, the operational aspect of drafting TP documentation is a critical component of TP compliance processes, as such documentation is essential for demonstrating compliance with international tax regulations and supporting the arm's length nature of intercompany transactions. The importance of TP documentation is widely recognised: It serves as evidence during tax audits, providing transparency and justifying the pricing methodologies applied to related-party transactions. This documentation involves compiling detailed reports that include descriptions of the business structure, industry analysis, functional and risk analysis, and economic analysis of intercompany transactions. The operational activities involved in preparing TP documentation include gathering and analysing relevant financial data, conducting comparability analyses, and substantiating the applied TP methods.
Effective TP compliance management helps mitigate the risk of penalties and legal issues, ensuring the company’s financial practices are transparent and in line with regulatory requirements.
Intercompany agreement management and maintenance
Intercompany agreement management and maintenance are essential processes that ensure the contractual terms governing transactions between related entities are transparent, consistent, and compliant with the arm's length principle. These agreements serve as formal documentation that substantiates the nature and terms of intercompany transactions for tax authorities, thereby reducing the risk of audits and penalties. The activities involved include drafting precise and comprehensive agreements that detail the pricing methodologies, payment terms, and roles and responsibilities of each party. This process also involves regularly reviewing and updating agreements to reflect changes in business operations, regulatory requirements, or market conditions. Additionally, maintaining a centralized repository for these agreements facilitates easy retrieval and reference during internal audits or tax inspections. Effective management and maintenance of intercompany agreements help ensure that all related-party transactions are legally sound, properly documented, and compliant with international TP regulations, thereby supporting the integrity and defensibility of the company’s TP strategy. Equally, ensuring that the financial commitments that are set out in the intercompany agreements are executed in line with the contractual terms is critical to ensure that the transfer pricing position is appropriately supported.
Read More

UAE’s TP Debut – What to Expect from its First OECD
UAE’s TP Debut – What to Expect from its First OECD
The United Arab Emirates (UAE) is quickly emerging as a key jurisdiction in the global transfer pricing (TP) landscape. As the UAE gears up for its first-ever Transfer Pricing Country Profile under the OECD framework, multinational enterprises (MNEs), tax advisors, and regulators alike are watching closely. This anticipated move represents not just the formal alignment of the UAE with OECD-compliant practices but also a pivotal step in the country’s growing reputation as a modern, transparent, and globally integrated tax jurisdiction.
Let’s explore what stakeholders can expect from the UAE’s forthcoming OECD TP profile, and how it fits into the broader global tax framework.
Brief Background: UAE’s Transfer Pricing Journey
Although the UAE historically functioned as a low-tax or no-tax jurisdiction, its Corporate Tax Law (effective from 1 June 2023) has significantly transformed its tax landscape. This includes:
Introduction of transfer pricing rules aligned with the OECD Transfer Pricing Guidelines.
Requirement for arm’s length principle in related-party transactions.
Master File, Local File, and Country-by-Country Reporting (CbCR) thresholds in line with BEPS Action 13.
Publication of Ministerial Decision No. 97 of 2023, providing guidance on TP documentation and disclosure requirements.
Now, with the OECD preparing to publish the UAE’s Transfer Pricing Country Profile, the Emirates is taking another step toward transparency and international credibility.
Key Components Expected in the OECD Profile
Based on the standard OECD format and the UAE’s domestic regulations, here’s what we expect to see in its debut profile:
Transfer Pricing Methods
The UAE endorses the full range of OECD-recommended methods: Comparable Uncontrolled Price (CUP), Resale Price, Cost Plus, TNMM, and Profit Split.
The most appropriate method rule is applicable.
Application of the Arm’s Length Principle
The UAE follows the OECD’s arm’s length principle, consistent with Article 9 of the OECD Model Tax Convention.
Related party transactions are benchmarked against third-party comparable transactions.
Documentation Requirements
Master File & Local File required for entities crossing global and local thresholds:
AED 3.15 billion in consolidated global revenue (Master File).
AED 200 million in local revenue or expenses (Local File).
CbCR reporting mandatory for UAE-headquartered MNEs exceeding AED 3.15 billion in consolidated group revenue.
Benchmarking and Comparability
Expect the profile to confirm that local or regional benchmarking studies are not mandatory, but OECD-aligned economic analyses are required.
The interquartile range is likely to be the default range for comparability adjustments.
Inclusion of HTVI and Amount B
The OECD is actively adding Hard-to-Value Intangibles (HTVI) and Amount B (simplified pricing for baseline distributors) to member and non-member profiles.
Given the UAE’s commitment to BEPS and recent alignment efforts, its profile is likely to:
Acknowledge HTVI guidance as applicable.
Evaluate or adopt Amount B for routine marketing/distribution transactions.
Dispute Resolution: Is the UAE Ready for MAP and APAs?
The UAE has taken early steps to build tax treaty-based dispute resolution mechanisms, including:
Inclusion of Mutual Agreement Procedure (MAP) clauses in recent double tax treaties.
Potential rollout of Advance Pricing Arrangements (APAs) through future administrative circulars or guidance.
While the OECD Country Profile may initially state “Not Applicable” or “Under Development” for APAs, the UAE is expected to provide MAP access via treaty partners, particularly where it aligns with Article 25 of the OECD Model Convention.
The United Arab Emirates (UAE) is quickly emerging as a key jurisdiction in the global transfer pricing (TP) landscape. As the UAE gears up for its first-ever Transfer Pricing Country Profile under the OECD framework, multinational enterprises (MNEs), tax advisors, and regulators alike are watching closely. This anticipated move represents not just the formal alignment of the UAE with OECD-compliant practices but also a pivotal step in the country’s growing reputation as a modern, transparent, and globally integrated tax jurisdiction.
Let’s explore what stakeholders can expect from the UAE’s forthcoming OECD TP profile, and how it fits into the broader global tax framework.
Brief Background: UAE’s Transfer Pricing Journey
Although the UAE historically functioned as a low-tax or no-tax jurisdiction, its Corporate Tax Law (effective from 1 June 2023) has significantly transformed its tax landscape. This includes:
Introduction of transfer pricing rules aligned with the OECD Transfer Pricing Guidelines.
Requirement for arm’s length principle in related-party transactions.
Master File, Local File, and Country-by-Country Reporting (CbCR) thresholds in line with BEPS Action 13.
Publication of Ministerial Decision No. 97 of 2023, providing guidance on TP documentation and disclosure requirements.
Now, with the OECD preparing to publish the UAE’s Transfer Pricing Country Profile, the Emirates is taking another step toward transparency and international credibility.
Key Components Expected in the OECD Profile
Based on the standard OECD format and the UAE’s domestic regulations, here’s what we expect to see in its debut profile:
Transfer Pricing Methods
The UAE endorses the full range of OECD-recommended methods: Comparable Uncontrolled Price (CUP), Resale Price, Cost Plus, TNMM, and Profit Split.
The most appropriate method rule is applicable.
Application of the Arm’s Length Principle
The UAE follows the OECD’s arm’s length principle, consistent with Article 9 of the OECD Model Tax Convention.
Related party transactions are benchmarked against third-party comparable transactions.
Documentation Requirements
Master File & Local File required for entities crossing global and local thresholds:
AED 3.15 billion in consolidated global revenue (Master File).
AED 200 million in local revenue or expenses (Local File).
CbCR reporting mandatory for UAE-headquartered MNEs exceeding AED 3.15 billion in consolidated group revenue.
Benchmarking and Comparability
Expect the profile to confirm that local or regional benchmarking studies are not mandatory, but OECD-aligned economic analyses are required.
The interquartile range is likely to be the default range for comparability adjustments.
Inclusion of HTVI and Amount B
The OECD is actively adding Hard-to-Value Intangibles (HTVI) and Amount B (simplified pricing for baseline distributors) to member and non-member profiles.
Given the UAE’s commitment to BEPS and recent alignment efforts, its profile is likely to:
Acknowledge HTVI guidance as applicable.
Evaluate or adopt Amount B for routine marketing/distribution transactions.
Dispute Resolution: Is the UAE Ready for MAP and APAs?
The UAE has taken early steps to build tax treaty-based dispute resolution mechanisms, including:
Inclusion of Mutual Agreement Procedure (MAP) clauses in recent double tax treaties.
Potential rollout of Advance Pricing Arrangements (APAs) through future administrative circulars or guidance.
While the OECD Country Profile may initially state “Not Applicable” or “Under Development” for APAs, the UAE is expected to provide MAP access via treaty partners, particularly where it aligns with Article 25 of the OECD Model Convention.
Read More

Transfer Pricing in the USA - 2025 Guide
Transfer Pricing in the USA - 2025 Guide
What is Transfer Pricing?
Transfer pricing refers to the pricing of goods, services, and intangibles between related entities within a multinational enterprise (MNE). It ensures that intra-group transactions reflect the arm’s length principle — i.e., pricing as if the transaction happened between unrelated parties.
In the United States, transfer pricing is governed by Section 482 of the Internal Revenue Code (IRC) and enforced by the Internal Revenue Service (IRS).
When is Transfer Pricing Applicable?
Transfer pricing rules apply when:
A U.S. entity transacts with foreign or domestic related parties
Transactions include goods, services, IP, financing, or cost sharing
The pricing affects the U.S. taxable income
Examples:
U.S. parent sells products to its EU subsidiary
U.S. subsidiary licenses software from its Singapore headquarters
Group treasury provides intercompany loans
Transfer Pricing Methods Accepted by the IRS
The IRS accepts several OECD-aligned methods to determine arm’s length pricing:
Traditional Transaction Methods
Comparable Uncontrolled Price (CUP)
Resale Price Method
Cost Plus Method
Transactional Profit Methods
Comparable Profits Method (CPM) – Most commonly used in the U.S.
Profit Split Method
Transactional Net Margin Method (TNMM)
Best Method Rule: The most reliable method based on facts, functions, and data must be selected.
Transfer Pricing Documentation Requirements in the U.S.
Under IRC §6662(e), U.S. taxpayers must prepare contemporaneous transfer pricing documentation, which should include:
Description of the entity and group structure
Functional and risk analysis
Description of controlled transactions
Method selection rationale
Benchmarking and comparables analysis
Key 2025 Transfer Pricing Developments in the U.S.
Global Minimum Tax & Pillar Two
U.S. GILTI regime evolving to align with OECD’s 15% global minimum tax.
Affects U.S. MNEs with foreign subsidiaries in low-tax countries.
Increased IRS Scrutiny & TP Audits
Focused audits on:
Cost-sharing arrangements
IP migration
Distribution entities with low profit margins
Intercompany loans and financial guarantees
Advance Pricing Agreements (APA) Surge
Record number of bilateral APAs filed in 2024–25, especially with:
Japan
UK
Germany
APAs provide certainty and avoid costly disputes.
Digital Economy & Intangibles
High scrutiny on:
DEMPE analysis (Development, Enhancement, Maintenance, Protection, Exploitation)
Digital IP structures
Platform and user-data monetization
U.S. Transfer Pricing vs. Global Rules (OECD)
Aspect | U.S. Approach | OECD Guidelines |
Governing Law | IRC §482 | OECD TP Guidelines (2022–2025) |
Most Used Method | CPM | TNMM / Profit Split |
Documentation Requirement | Mandatory (IRC §6662) | Master file, local file, CbCR |
Penalties | 20–40% | Country-dependent |
Pillar One/Two Compliance | GILTI + potential Pillar 2 alignment | In implementation phase |
Future of Transfer Pricing in the U.S. (2025–26 Outlook)
Stronger push for tax transparency
Increasing relevance of CbCR (Country-by-Country Reporting)
IRS use of AI tools and data analytics in TP enforcement
Cross-border dispute resolution through MAP (Mutual Agreement Procedures)
Upcoming updates to cost-sharing regulations and profit split methods
Conclusion
The U.S. transfer pricing landscape is becoming more integrated with OECD global standards while retaining its own robust enforcement framework. With regulatory convergence, digital economy taxation, and GloBE rules taking center stage, MNEs must proactively manage TP risk.
What is Transfer Pricing?
Transfer pricing refers to the pricing of goods, services, and intangibles between related entities within a multinational enterprise (MNE). It ensures that intra-group transactions reflect the arm’s length principle — i.e., pricing as if the transaction happened between unrelated parties.
In the United States, transfer pricing is governed by Section 482 of the Internal Revenue Code (IRC) and enforced by the Internal Revenue Service (IRS).
When is Transfer Pricing Applicable?
Transfer pricing rules apply when:
A U.S. entity transacts with foreign or domestic related parties
Transactions include goods, services, IP, financing, or cost sharing
The pricing affects the U.S. taxable income
Examples:
U.S. parent sells products to its EU subsidiary
U.S. subsidiary licenses software from its Singapore headquarters
Group treasury provides intercompany loans
Transfer Pricing Methods Accepted by the IRS
The IRS accepts several OECD-aligned methods to determine arm’s length pricing:
Traditional Transaction Methods
Comparable Uncontrolled Price (CUP)
Resale Price Method
Cost Plus Method
Transactional Profit Methods
Comparable Profits Method (CPM) – Most commonly used in the U.S.
Profit Split Method
Transactional Net Margin Method (TNMM)
Best Method Rule: The most reliable method based on facts, functions, and data must be selected.
Transfer Pricing Documentation Requirements in the U.S.
Under IRC §6662(e), U.S. taxpayers must prepare contemporaneous transfer pricing documentation, which should include:
Description of the entity and group structure
Functional and risk analysis
Description of controlled transactions
Method selection rationale
Benchmarking and comparables analysis
Key 2025 Transfer Pricing Developments in the U.S.
Global Minimum Tax & Pillar Two
U.S. GILTI regime evolving to align with OECD’s 15% global minimum tax.
Affects U.S. MNEs with foreign subsidiaries in low-tax countries.
Increased IRS Scrutiny & TP Audits
Focused audits on:
Cost-sharing arrangements
IP migration
Distribution entities with low profit margins
Intercompany loans and financial guarantees
Advance Pricing Agreements (APA) Surge
Record number of bilateral APAs filed in 2024–25, especially with:
Japan
UK
Germany
APAs provide certainty and avoid costly disputes.
Digital Economy & Intangibles
High scrutiny on:
DEMPE analysis (Development, Enhancement, Maintenance, Protection, Exploitation)
Digital IP structures
Platform and user-data monetization
U.S. Transfer Pricing vs. Global Rules (OECD)
Aspect | U.S. Approach | OECD Guidelines |
Governing Law | IRC §482 | OECD TP Guidelines (2022–2025) |
Most Used Method | CPM | TNMM / Profit Split |
Documentation Requirement | Mandatory (IRC §6662) | Master file, local file, CbCR |
Penalties | 20–40% | Country-dependent |
Pillar One/Two Compliance | GILTI + potential Pillar 2 alignment | In implementation phase |
Future of Transfer Pricing in the U.S. (2025–26 Outlook)
Stronger push for tax transparency
Increasing relevance of CbCR (Country-by-Country Reporting)
IRS use of AI tools and data analytics in TP enforcement
Cross-border dispute resolution through MAP (Mutual Agreement Procedures)
Upcoming updates to cost-sharing regulations and profit split methods
Conclusion
The U.S. transfer pricing landscape is becoming more integrated with OECD global standards while retaining its own robust enforcement framework. With regulatory convergence, digital economy taxation, and GloBE rules taking center stage, MNEs must proactively manage TP risk.
Read More
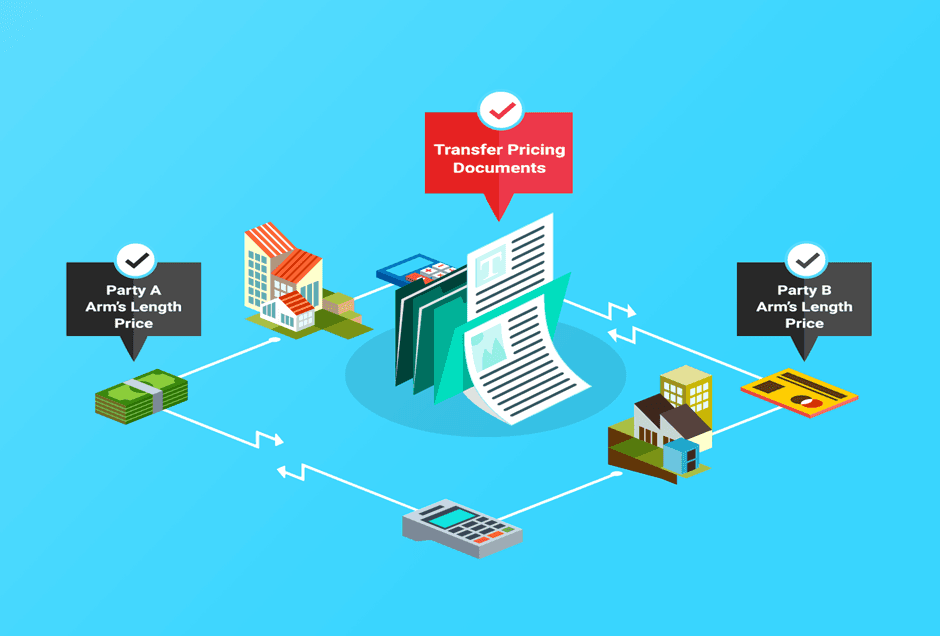
Master File and Local File - The Backbone of TP Documentation
Master File and Local File - The Backbone of TP Documentation
Introduction
As part of the OECD’s three-tier documentation framework (BEPS Action 13), the Master File and Local File serve as cornerstones for demonstrating arm’s length compliance.
Master File
High-level information on global operations, intangibles, financials, and TP policies.
Common for all jurisdictions where the MNE operates.
Local File
Transaction-specific details relevant to each local jurisdiction.
Includes functional analysis, method selection, and benchmarking.
OECD and Indian Framework
India’s Rule 10D requires detailed documentation in line with OECD.
Timely maintenance and accurate segmentation are essential.
Challenges and Best Practices
Data availability and consistency across entities
Coordination between global and local teams
Customization without duplicating global policies
Conclusion
Master File and Local File documentation ensure transparency and audit readiness. Consistency and precision across both levels are key to avoiding disputes and penalties.
Introduction
As part of the OECD’s three-tier documentation framework (BEPS Action 13), the Master File and Local File serve as cornerstones for demonstrating arm’s length compliance.
Master File
High-level information on global operations, intangibles, financials, and TP policies.
Common for all jurisdictions where the MNE operates.
Local File
Transaction-specific details relevant to each local jurisdiction.
Includes functional analysis, method selection, and benchmarking.
OECD and Indian Framework
India’s Rule 10D requires detailed documentation in line with OECD.
Timely maintenance and accurate segmentation are essential.
Challenges and Best Practices
Data availability and consistency across entities
Coordination between global and local teams
Customization without duplicating global policies
Conclusion
Master File and Local File documentation ensure transparency and audit readiness. Consistency and precision across both levels are key to avoiding disputes and penalties.
Read More

Global Benchmarking Practices in Transfer Pricing: A Comparative Overview
Global Benchmarking Practices in Transfer Pricing: A Comparative Overview
Introduction
While the arm’s length principle is globally accepted, benchmarking approaches differ significantly across countries. This blog explores those key differences and best practices globally.
Key Global Differences
Acceptance of multiple year data (common in the US, not in India)
Use of global vs. regional comparables
Tax authority databases vs. commercial ones (e.g., Orbis, RoyaltyStat, ktMINE)
Local file requirements in EU vs. more flexible approaches in ASEAN
Country Snapshots
USA: CUP method focus, use of internal comparables, reliance on IRS regulations
UK: Flexible but OECD-aligned; HMRC encourages early discussions on methodology
Australia: Rigorous analysis of DEMPE functions and value chain
Singapore/Malaysia: More lenient on local comparable availability, but stricter on related-party disclosures
Challenges in Cross-Border Benchmarking
Currency adjustments
Geographic market differences
Differences in economic cycles
Language and financial reporting format barriers
Conclusion
Global benchmarking requires adapting to local expectations while ensuring consistency with group policies. Multinationals must tailor their approach to each jurisdiction while maintaining an overarching arm’s length policy.
Introduction
While the arm’s length principle is globally accepted, benchmarking approaches differ significantly across countries. This blog explores those key differences and best practices globally.
Key Global Differences
Acceptance of multiple year data (common in the US, not in India)
Use of global vs. regional comparables
Tax authority databases vs. commercial ones (e.g., Orbis, RoyaltyStat, ktMINE)
Local file requirements in EU vs. more flexible approaches in ASEAN
Country Snapshots
USA: CUP method focus, use of internal comparables, reliance on IRS regulations
UK: Flexible but OECD-aligned; HMRC encourages early discussions on methodology
Australia: Rigorous analysis of DEMPE functions and value chain
Singapore/Malaysia: More lenient on local comparable availability, but stricter on related-party disclosures
Challenges in Cross-Border Benchmarking
Currency adjustments
Geographic market differences
Differences in economic cycles
Language and financial reporting format barriers
Conclusion
Global benchmarking requires adapting to local expectations while ensuring consistency with group policies. Multinationals must tailor their approach to each jurisdiction while maintaining an overarching arm’s length policy.
Read More

MAP & APA 2025 – Rising Complexity in TP Dispute Resolution
MAP & APA 2025 – Rising Complexity in TP Dispute Resolution
Recent OECD Insights
By November 2024, OECD reported that transfer pricing MAP cases average 32 months to resolution OECD.
As of 2023, over 4,000 APAs are active globally, with an average of 36.8 months to close, typically bilateral cases OECD.
Country-Specific Observations
USA: IRS APMA program offers both unilateral and bilateral APAs; timelines are lengthy but provide certainty.
UK & Europe: HMRC and EU countries frequently engage in pre-filing APA discussions; increased preference for multilateral APAs.
UAE: Still building dispute resolution frameworks; APAs expected to grow rapidly.
Australia: ATO uses APAs proactively; guidance on financial transactions added.
South Africa: APA facility is underutilized; initiatives to streamline procedures are underway.
Best Practices for Taxpayers
Plan for the long haul: Expect 2–3 years in negotiation and resolution.
Push for multilateral APAs: Gain broader protection across countries.
Build audits around ex-ante documentation: Robust FAR and HTVI proof supports credible agreements.
Recent OECD Insights
By November 2024, OECD reported that transfer pricing MAP cases average 32 months to resolution OECD.
As of 2023, over 4,000 APAs are active globally, with an average of 36.8 months to close, typically bilateral cases OECD.
Country-Specific Observations
USA: IRS APMA program offers both unilateral and bilateral APAs; timelines are lengthy but provide certainty.
UK & Europe: HMRC and EU countries frequently engage in pre-filing APA discussions; increased preference for multilateral APAs.
UAE: Still building dispute resolution frameworks; APAs expected to grow rapidly.
Australia: ATO uses APAs proactively; guidance on financial transactions added.
South Africa: APA facility is underutilized; initiatives to streamline procedures are underway.
Best Practices for Taxpayers
Plan for the long haul: Expect 2–3 years in negotiation and resolution.
Push for multilateral APAs: Gain broader protection across countries.
Build audits around ex-ante documentation: Robust FAR and HTVI proof supports credible agreements.
Read More

CbCR Reporting – Transparency and Risk Assessment
CbCR Reporting – Transparency and Risk Assessment
Introduction
Country-by-Country Reporting (CbCR), introduced by the OECD under BEPS Action 13, mandates large MNEs to disclose global revenue, profits, taxes paid, and economic activity by jurisdiction.
Who Must File
MNE groups with consolidated revenue > EUR 750 million.
Typically filed by the parent entity and shared with tax authorities via automatic exchange.
Key Components of CbCR
Revenue, profit/loss before tax, income tax paid/accrued
Number of employees, tangible assets, stated capital
List of entities and business activities
India’s Framework
Applicable to Indian-headquartered MNEs and foreign MNEs with Indian subsidiaries
Reporting required under Rule 10DB and Form 3CEAC/3CEAD
Impact on TP Risk Assessment
Enables tax authorities to conduct high-level risk analysis
Used to select cases for detailed TP audits
Conclusion
CbCR is a powerful transparency tool. While it does not replace traditional TP documentation, it reinforces the need for coherence between business substance, profit allocation, and tax disclosures.
Introduction
Country-by-Country Reporting (CbCR), introduced by the OECD under BEPS Action 13, mandates large MNEs to disclose global revenue, profits, taxes paid, and economic activity by jurisdiction.
Who Must File
MNE groups with consolidated revenue > EUR 750 million.
Typically filed by the parent entity and shared with tax authorities via automatic exchange.
Key Components of CbCR
Revenue, profit/loss before tax, income tax paid/accrued
Number of employees, tangible assets, stated capital
List of entities and business activities
India’s Framework
Applicable to Indian-headquartered MNEs and foreign MNEs with Indian subsidiaries
Reporting required under Rule 10DB and Form 3CEAC/3CEAD
Impact on TP Risk Assessment
Enables tax authorities to conduct high-level risk analysis
Used to select cases for detailed TP audits
Conclusion
CbCR is a powerful transparency tool. While it does not replace traditional TP documentation, it reinforces the need for coherence between business substance, profit allocation, and tax disclosures.
Read More

Dispute Resolution Mechanisms under OECD Guidelines
Dispute Resolution Mechanisms under OECD Guidelines
Introduction
Transfer pricing is inherently subjective, and disagreements between tax authorities and taxpayers are inevitable. To address these conflicts fairly and efficiently, the OECD recommends various dispute resolution mechanisms, especially in the context of cross-border intercompany transactions. This blog explores the OECD’s approach to resolving such disputes and its relevance in today’s global tax environment.
Common Causes of Transfer Pricing Disputes
Disagreement over the application of the arm’s length principle
Selection and application of TP methods
Use of comparables and adjustments
Interpretation of tax treaties and documentation sufficiency
OECD’s Recommended Dispute Resolution Mechanisms
Mutual Agreement Procedure (MAP)
A process available under tax treaties based on the OECD Model Convention.
Allows competent authorities of two jurisdictions to resolve tax disputes involving double taxation.
Typically initiated by the taxpayer and involves no fee.
Advance Pricing Agreements (APAs)
Agreements between a taxpayer and tax authority (or authorities) on the appropriate TP methodology for future transactions.
Can be unilateral, bilateral, or multilateral.
Provide certainty, reduce compliance costs, and prevent future disputes.
Arbitration
Introduced under the OECD Model Tax Convention to enhance the effectiveness of MAP.
If competent authorities cannot reach agreement within a set timeframe (e.g., 2 years), an independent arbitration panel resolves the issue.
Binding in nature and fosters timely resolution.
Enhancements under BEPS Action 14
BEPS Action 14 seeks to make dispute resolution mechanisms more effective. Key elements include:
Timely access to MAP
Transparency and consistency in process
Binding arbitration for unresolved MAP cases
Increased reporting and monitoring
India’s Position
India has robust MAP and APA frameworks but does not support mandatory binding arbitration under its tax treaties.
APAs are gaining popularity with both unilateral and bilateral agreements being actively used.
India has reformed its MAP processes to align better with Action 14 recommendations, improving timelines and transparency.
Best Practices for Taxpayers
Maintain thorough and consistent documentation
Engage proactively with tax authorities
Leverage APAs to avoid future disputes
Stay informed of treaty positions and procedural changes
Conclusion
The OECD’s dispute resolution mechanisms, particularly MAP, APAs, and arbitration, provide critical tools for resolving transfer pricing disputes. As scrutiny from tax authorities increases, MNEs must be prepared not only to defend their positions but also to resolve conflicts efficiently and equitably. Proactive planning and early engagement with these mechanisms can significantly reduce uncertainty and litigation.
Introduction
Transfer pricing is inherently subjective, and disagreements between tax authorities and taxpayers are inevitable. To address these conflicts fairly and efficiently, the OECD recommends various dispute resolution mechanisms, especially in the context of cross-border intercompany transactions. This blog explores the OECD’s approach to resolving such disputes and its relevance in today’s global tax environment.
Common Causes of Transfer Pricing Disputes
Disagreement over the application of the arm’s length principle
Selection and application of TP methods
Use of comparables and adjustments
Interpretation of tax treaties and documentation sufficiency
OECD’s Recommended Dispute Resolution Mechanisms
Mutual Agreement Procedure (MAP)
A process available under tax treaties based on the OECD Model Convention.
Allows competent authorities of two jurisdictions to resolve tax disputes involving double taxation.
Typically initiated by the taxpayer and involves no fee.
Advance Pricing Agreements (APAs)
Agreements between a taxpayer and tax authority (or authorities) on the appropriate TP methodology for future transactions.
Can be unilateral, bilateral, or multilateral.
Provide certainty, reduce compliance costs, and prevent future disputes.
Arbitration
Introduced under the OECD Model Tax Convention to enhance the effectiveness of MAP.
If competent authorities cannot reach agreement within a set timeframe (e.g., 2 years), an independent arbitration panel resolves the issue.
Binding in nature and fosters timely resolution.
Enhancements under BEPS Action 14
BEPS Action 14 seeks to make dispute resolution mechanisms more effective. Key elements include:
Timely access to MAP
Transparency and consistency in process
Binding arbitration for unresolved MAP cases
Increased reporting and monitoring
India’s Position
India has robust MAP and APA frameworks but does not support mandatory binding arbitration under its tax treaties.
APAs are gaining popularity with both unilateral and bilateral agreements being actively used.
India has reformed its MAP processes to align better with Action 14 recommendations, improving timelines and transparency.
Best Practices for Taxpayers
Maintain thorough and consistent documentation
Engage proactively with tax authorities
Leverage APAs to avoid future disputes
Stay informed of treaty positions and procedural changes
Conclusion
The OECD’s dispute resolution mechanisms, particularly MAP, APAs, and arbitration, provide critical tools for resolving transfer pricing disputes. As scrutiny from tax authorities increases, MNEs must be prepared not only to defend their positions but also to resolve conflicts efficiently and equitably. Proactive planning and early engagement with these mechanisms can significantly reduce uncertainty and litigation.
Read More

Advance Pricing Agreements (APAs) – A Tool for Certainty in Transfer Pricing
Advance Pricing Agreements (APAs) – A Tool for Certainty in Transfer Pricing
Introduction
Advance Pricing Agreements (APAs) provide a proactive means of achieving tax certainty in transfer pricing. Supported by the OECD and adopted by many countries, APAs reduce the risk of disputes by establishing the transfer pricing methodology for future transactions in advance.
Types of APAs
Unilateral: Agreement between the taxpayer and one tax authority.
Bilateral: Agreement between the tax authorities of both jurisdictions involved.
Multilateral: Involving more than two tax jurisdictions.
OECD Framework and Guidance
Encourages tax administrations to adopt APA programs aligned with OECD principles.
Promotes transparency, consistency, and mutual agreement between jurisdictions.
India’s APA Program
Operational since 2012 with robust growth in both unilateral and bilateral APAs.
Covers complex transactions like contract R&D, distribution, and financial services.
Pre-filing consultation, filing, evaluation, negotiation, and final agreement stages.
Benefits
Reduces litigation and double taxation.
Improves investor confidence and stability.
Provides forward-looking clarity for 5+ years
Conclusion
APAs represent a strategic compliance tool for MNEs operating in multiple jurisdictions. With support from both OECD and Indian frameworks, APAs ensure a defensible and consistent transfer pricing policy.
Introduction
Advance Pricing Agreements (APAs) provide a proactive means of achieving tax certainty in transfer pricing. Supported by the OECD and adopted by many countries, APAs reduce the risk of disputes by establishing the transfer pricing methodology for future transactions in advance.
Types of APAs
Unilateral: Agreement between the taxpayer and one tax authority.
Bilateral: Agreement between the tax authorities of both jurisdictions involved.
Multilateral: Involving more than two tax jurisdictions.
OECD Framework and Guidance
Encourages tax administrations to adopt APA programs aligned with OECD principles.
Promotes transparency, consistency, and mutual agreement between jurisdictions.
India’s APA Program
Operational since 2012 with robust growth in both unilateral and bilateral APAs.
Covers complex transactions like contract R&D, distribution, and financial services.
Pre-filing consultation, filing, evaluation, negotiation, and final agreement stages.
Benefits
Reduces litigation and double taxation.
Improves investor confidence and stability.
Provides forward-looking clarity for 5+ years
Conclusion
APAs represent a strategic compliance tool for MNEs operating in multiple jurisdictions. With support from both OECD and Indian frameworks, APAs ensure a defensible and consistent transfer pricing policy.
Read More
2022 OECD Transfer Pricing Guidelines - Comprehensive Revisions and Practical Insights
2022 OECD Transfer Pricing Guidelines - Comprehensive Revisions and Practical Insights
Introduction
The 2022 edition of the OECD Transfer Pricing Guidelines consolidates years of updates including BEPS-related revisions and Chapter X on financial transactions. It is now the most authoritative source for aligning transfer pricing with value creation.
Key Revisions in the 2022 Guidelines
Chapter I-III Updates:
Enhanced guidance on comparability and selection of the most appropriate method.
Focus on accurate delineation of transactions.
HTVI Guidance (Action 8):
Provides tools for addressing information asymmetry.
Allows tax authorities to make ex-post pricing adjustments where outcomes deviate significantly from projections.
Financial Transactions (Chapter X):
Introduced in 2020 and integrated into 2022 Guidelines.
Covers intra-group loans, cash pooling, financial guarantees, captive insurance.
Emphasizes credit rating analysis and risk-adjusted return models.
Impact on MNEs
Clearer application of profit split and TNMM methods.
Stricter compliance for intercompany finance and intangibles.
Urges use of detailed documentation and DEMPE analysis.
Compliance Focus for Indian Companies
Document all DEMPE-related functions and value drivers.
Maintain internal comparables where possible.
Strengthen intercompany funding agreements with economic analyses.
Conclusion
The 2022 Guidelines are more than just an update—they are a redefined standard for transfer pricing governance. With expanded coverage on intangibles and financial flows, companies need to realign their policies and documentation to stay compliant and audit-ready.
Introduction
The 2022 edition of the OECD Transfer Pricing Guidelines consolidates years of updates including BEPS-related revisions and Chapter X on financial transactions. It is now the most authoritative source for aligning transfer pricing with value creation.
Key Revisions in the 2022 Guidelines
Chapter I-III Updates:
Enhanced guidance on comparability and selection of the most appropriate method.
Focus on accurate delineation of transactions.
HTVI Guidance (Action 8):
Provides tools for addressing information asymmetry.
Allows tax authorities to make ex-post pricing adjustments where outcomes deviate significantly from projections.
Financial Transactions (Chapter X):
Introduced in 2020 and integrated into 2022 Guidelines.
Covers intra-group loans, cash pooling, financial guarantees, captive insurance.
Emphasizes credit rating analysis and risk-adjusted return models.
Impact on MNEs
Clearer application of profit split and TNMM methods.
Stricter compliance for intercompany finance and intangibles.
Urges use of detailed documentation and DEMPE analysis.
Compliance Focus for Indian Companies
Document all DEMPE-related functions and value drivers.
Maintain internal comparables where possible.
Strengthen intercompany funding agreements with economic analyses.
Conclusion
The 2022 Guidelines are more than just an update—they are a redefined standard for transfer pricing governance. With expanded coverage on intangibles and financial flows, companies need to realign their policies and documentation to stay compliant and audit-ready.
Read More

Benchmarking: A Deep Dive Based on OECD Insights (2024–2025)
Benchmarking: A Deep Dive Based on OECD Insights (2024–2025)
Benchmarking is more than just data comparison—it’s a vital strategic process used by governments, businesses, and institutions to elevate performance, improve policymaking, and drive innovation. Drawing on OECD’s 2024–2025 studies, here’s a comprehensive exploration of benchmarking in today’s context.
1. What Is Benchmarking—and Why It Matters
Benchmarking entails systematically comparing metrics—whether performance, investment, policy outcomes, or processes—against peer institutions or ideal standards. The OECD emphasizes it as essential for:
• Informing policy and programme design (e.g., venture capital [VC] schemes)
• Tracking SME and entrepreneurship policy effectiveness through benchmarks and monitoring/evaluation systems
• Ensuring consistent macroeconomic statistics (e.g., FDI vs. GDP) through standardized definitions
By benchmarking, decision-makers can detect performance gaps, share best practices, and set measurable improvement goals.
OECD Findings on Benchmarking (2024–2025)
Venture Capital Support
The report “Benchmarking Government Support for Venture Capital” analyzes nine OECD countries and highlights how governments engage in VC markets:
• VC investment rose significantly post-2008, driven by fiscal trends and institutional investor interest
• Preference has shifted toward indirect or fund-of-fund models and growth-stage support
• Nordic countries (e.g., Denmark) channel pension funds into VC via public banks
• In the US, public VC is smaller (~3% of deals) compared to Europe (~11%), mainly through SBIC and SSBCI
Takeaway: OECD benchmarking reveals a variety of national approaches—direct vs. indirect, early- vs. late-stage—which guide evidence-based policy refinement.
SME & Entrepreneurship Policy
The OECD provides a robust evaluation toolkit that:
• Establishes monitoring and evaluation criteria for SME and entrepreneurship programs
• Emphasizes the need for consistent business statistics (e.g., business births, employment, turnover) to enable cross-country benchmarking
Impact: Better data leads to smarter policies that empower SMEs and foster entrepreneurship with precision and accountability.
FDI Standards & Global Comparability
The 2025 5th Edition of the OECD Benchmark Definition of FDI aims to further harmonize global data by:
• Introducing standardized FDI purpose indicators (e.g., greenfield, M&A)
• Aligning with international statistical frameworks like IMF’s BPM7 and the UN’s SNA 2025
Outcome: Benchmarked international FDI statistics allow reliable cross-border investment comparisons—strengthening analysis and policymaking.
Benchmarking Best Practices
Based on OECD insights and industry models, successful benchmarking involves:
Define clear objectives (e.g., increase VC investments, boost SME dynamism)
Select peer benchmarks (countries/sectors with proven results)
Establish key metrics (e.g., VC volume, SME entry/exit rates, FDI flows)
Collect data using standardized definitions (e.g., OECD-compliant FDI rules)
Analyze gaps and discrepancies
Set improvement targets and track progress (e.g., raising VC share from 3% to 11%)
Share insights and best practices across networks and platforms
Broader Impact & Policy Takeaways
• Higher accountability: Benchmarking creates transparency and builds public trust
• Policy calibration: Enables tailored programs, like targeting growth-stage VC or SME digital adoption
• Cross-border learning: Nations adapt proven models (e.g., Nordic pension-funded VC)
• Innovation ecosystems: Drives economic growth, sustainability, and competitiveness
Looking Ahead: 2025 and Beyond
• Enhanced data systems: More frequent and detailed updates on VC, FDI, and SME indicators
• Sector-specific focus: Expansion into green-tech, deep-tech, and digital inclusion
• Stronger global collaboration: OECD, IMF, and regional partners integrating benchmarking for unified, informed policymaking
Conclusion
The OECD’s 2024–2025 benchmarking publications highlight the strategic power of turning data into action. Whether it’s supporting venture capital, shaping SME policies, or defining FDI standards, benchmarking helps drive transparency, improvement, and innovation. For policymakers, analysts, and business leaders, adopting structured benchmarking is key to building sustainable, competitive, and resilient economies.
Benchmarking is more than just data comparison—it’s a vital strategic process used by governments, businesses, and institutions to elevate performance, improve policymaking, and drive innovation. Drawing on OECD’s 2024–2025 studies, here’s a comprehensive exploration of benchmarking in today’s context.
1. What Is Benchmarking—and Why It Matters
Benchmarking entails systematically comparing metrics—whether performance, investment, policy outcomes, or processes—against peer institutions or ideal standards. The OECD emphasizes it as essential for:
• Informing policy and programme design (e.g., venture capital [VC] schemes)
• Tracking SME and entrepreneurship policy effectiveness through benchmarks and monitoring/evaluation systems
• Ensuring consistent macroeconomic statistics (e.g., FDI vs. GDP) through standardized definitions
By benchmarking, decision-makers can detect performance gaps, share best practices, and set measurable improvement goals.
OECD Findings on Benchmarking (2024–2025)
Venture Capital Support
The report “Benchmarking Government Support for Venture Capital” analyzes nine OECD countries and highlights how governments engage in VC markets:
• VC investment rose significantly post-2008, driven by fiscal trends and institutional investor interest
• Preference has shifted toward indirect or fund-of-fund models and growth-stage support
• Nordic countries (e.g., Denmark) channel pension funds into VC via public banks
• In the US, public VC is smaller (~3% of deals) compared to Europe (~11%), mainly through SBIC and SSBCI
Takeaway: OECD benchmarking reveals a variety of national approaches—direct vs. indirect, early- vs. late-stage—which guide evidence-based policy refinement.
SME & Entrepreneurship Policy
The OECD provides a robust evaluation toolkit that:
• Establishes monitoring and evaluation criteria for SME and entrepreneurship programs
• Emphasizes the need for consistent business statistics (e.g., business births, employment, turnover) to enable cross-country benchmarking
Impact: Better data leads to smarter policies that empower SMEs and foster entrepreneurship with precision and accountability.
FDI Standards & Global Comparability
The 2025 5th Edition of the OECD Benchmark Definition of FDI aims to further harmonize global data by:
• Introducing standardized FDI purpose indicators (e.g., greenfield, M&A)
• Aligning with international statistical frameworks like IMF’s BPM7 and the UN’s SNA 2025
Outcome: Benchmarked international FDI statistics allow reliable cross-border investment comparisons—strengthening analysis and policymaking.
Benchmarking Best Practices
Based on OECD insights and industry models, successful benchmarking involves:
Define clear objectives (e.g., increase VC investments, boost SME dynamism)
Select peer benchmarks (countries/sectors with proven results)
Establish key metrics (e.g., VC volume, SME entry/exit rates, FDI flows)
Collect data using standardized definitions (e.g., OECD-compliant FDI rules)
Analyze gaps and discrepancies
Set improvement targets and track progress (e.g., raising VC share from 3% to 11%)
Share insights and best practices across networks and platforms
Broader Impact & Policy Takeaways
• Higher accountability: Benchmarking creates transparency and builds public trust
• Policy calibration: Enables tailored programs, like targeting growth-stage VC or SME digital adoption
• Cross-border learning: Nations adapt proven models (e.g., Nordic pension-funded VC)
• Innovation ecosystems: Drives economic growth, sustainability, and competitiveness
Looking Ahead: 2025 and Beyond
• Enhanced data systems: More frequent and detailed updates on VC, FDI, and SME indicators
• Sector-specific focus: Expansion into green-tech, deep-tech, and digital inclusion
• Stronger global collaboration: OECD, IMF, and regional partners integrating benchmarking for unified, informed policymaking
Conclusion
The OECD’s 2024–2025 benchmarking publications highlight the strategic power of turning data into action. Whether it’s supporting venture capital, shaping SME policies, or defining FDI standards, benchmarking helps drive transparency, improvement, and innovation. For policymakers, analysts, and business leaders, adopting structured benchmarking is key to building sustainable, competitive, and resilient economies.
Read More

Role of TP Advisory: Beyond Compliance to Strategic Value
Role of TP Advisory: Beyond Compliance to Strategic Value
Introduction
Transfer pricing advisory has evolved from a compliance exercise to a strategic function. OECD guidelines increasingly stress proactive TP management and documentation, requiring expert interpretation and business alignment.
Scope of Advisory Services
TP policy design and documentation
Benchmarking and comparables analysis
Value chain structuring and restructuring
APA strategy and litigation support
OECD’s Expectations
TP is not a formulaic exercise, it requires understanding of business models.
Strategic TP advice supports effective BEPS compliance and dispute avoidance.
Benefits of Proactive TP Advisory
Minimizes risk of double taxation
Helps align with substance over form principle
Supports global consistency in documentation
Conclusion
Strong TP advisory plays a crucial role in building defensible and future ready pricing policies. MNEs should treat transfer pricing as an integrated strategic issue, not just a tax requirement.
Introduction
Transfer pricing advisory has evolved from a compliance exercise to a strategic function. OECD guidelines increasingly stress proactive TP management and documentation, requiring expert interpretation and business alignment.
Scope of Advisory Services
TP policy design and documentation
Benchmarking and comparables analysis
Value chain structuring and restructuring
APA strategy and litigation support
OECD’s Expectations
TP is not a formulaic exercise, it requires understanding of business models.
Strategic TP advice supports effective BEPS compliance and dispute avoidance.
Benefits of Proactive TP Advisory
Minimizes risk of double taxation
Helps align with substance over form principle
Supports global consistency in documentation
Conclusion
Strong TP advisory plays a crucial role in building defensible and future ready pricing policies. MNEs should treat transfer pricing as an integrated strategic issue, not just a tax requirement.
Read More

Profit Split Method in Transfer Pricing: Approach, Application, and Challenges
Profit Split Method in Transfer Pricing: Approach, Application, and Challenges
The profit split method is one of the accepted by the OECD to determine transfer prices when there are related party transactions. It is mainly employed when the transactions are highly integrated or when the companies involved contribute valuable intangibles that hinder the application of other traditional methods. Its objective is to equitably allocate the profits generated by the transaction under the Arm’s Length Principle. This method is regulated in the OECD Guidelines, particularly in Section C, Part III, Chapter II.
Application of the Profit Split Method
The implementation of this method is based on two main approaches:
Contribution analysis: This approach allocates the total related party transaction profits according to the relative value of contributions. These contributions are evaluated by considering functions performed, assets used, and risks assumed. This allocation must be supported with external market data reflecting the splitting process of profit in similar circumstances.
Residual analysis: In this case, profits are split into two categories. First, a base remuneration is allocated to each party, employing a traditional Transfer Pricing method or the Transactional Net Margin Method for contributions that can be compared to independent transactions. Then, any residual profit attributable to single contributions or high integration is allocated according to the relative value of these specific contributions.
Determination of the Profits to Be Split
For an accurate application of the method, relevant profits derived from the controlled transaction must be identified. Operating profits are usually considered, but in particular cases of market or production risks, gross profit should be used. A common accounting base must be adopted before combining profits and their expression in a uniform currency.
Criteria for the Profit Split
The profit split must be based on economically valid criteria reflecting the relative contributions of the involved parties by aligning with the Arm’s Length Principle, as set out in section C5 of the Revised Guidance on the Application of the Transactional Profit Split Method.
The factors or criteria used for splitting must comply with the following characteristics:
Independence: They must be unrelated to the internal Transfer Pricing policy and based on objective data, not on figures related to controlled transactions.
Verifiability: The criteria must be verifiable through adequate documentation.
Comparable data support: The allocation must be supported by external comparable data, internal information, or a combination of both.
Selection of Splitting Factors
The correct allocation of profits according to this method requires selecting objective criteria reflecting the relative contributions of each entity. Their selection depends on functional analysis and the transaction context, which must be supportable and verifiable economically.
One of the main factors used is the value of tangible and intangible assets employed by each party. In industries where intellectual property and technology play a determining role, the value of these assets becomes crucial to setting the profit split. In addition, the capital employed in the operation is considered since companies that invest more tend to take on more risk and should, therefore, receive more share of the profits.
Another common criterion is the level of operating expenses incurred by each entity, especially costs related to strategic activities such as research and development and marketing or distribution. In specific industries, the costs of these activities may accurately reflect the level of each company’s contribution to the transaction success.
Conversely, using these factors is not exempt from challenges. Appraising intangibles can sometimes be complex due to the lack of market benchmarks, which the former requires the use of specialized methodologies. Likewise, data used to determine the profit split must come from reliable sources and be consistent with the economic reality of the parties involved.
Challenges in Applying the Method
Despite its advantages, the profit split application has significant challenges:
Complexity in obtaining information: This method requires access to detailed and, often, confidential data from all parties involved in the transaction. Conversely, collecting this information can be complicated, specifically when companies operate in multiple jurisdictions with different tax regulations.
Difficulty in measuring contributions: Accurately quantifying the relative value of each entity’s contributions is a significant challenge, especially when intangible assets such as proprietary technology, trademarks, or specialized know-how are involved. The absence of reliable market benchmarks can lead to subjective estimates, increasing potential discrepancies between companies and tax administrations.
Need for reliable market data: In order to support the allocation of profits under this method, benchmark information on comparable independent-party transactions is essential. Conversely, this information is not always available or may be difficult to obtain. The lack of adequate comparables can lead to increased scrutiny by tax authorities, who may question the methodology employed and require adjustments to the profit allocation.
Due to the complexity of these challenges, companies adopting the profit split method should ensure detailed documentation and well-founded economic studies to support their approach. In addition, implementing advanced data analysis tools and the support of specialized consultants can be crucial to mitigate risks and ensure compliance with Transfer Pricing regulations in each jurisdiction they operate in.
Conclusion
The profit split method is valuable in Transfer Pricing, especially in transactions where the parties are closely integrated or bring unique and worthy elements. Its correct application ensures a fair allocation of profits, according to the Arm’s Length Principle, and reduces tax risks and potential disputes among tax jurisdictions.
The profit split method is one of the accepted by the OECD to determine transfer prices when there are related party transactions. It is mainly employed when the transactions are highly integrated or when the companies involved contribute valuable intangibles that hinder the application of other traditional methods. Its objective is to equitably allocate the profits generated by the transaction under the Arm’s Length Principle. This method is regulated in the OECD Guidelines, particularly in Section C, Part III, Chapter II.
Application of the Profit Split Method
The implementation of this method is based on two main approaches:
Contribution analysis: This approach allocates the total related party transaction profits according to the relative value of contributions. These contributions are evaluated by considering functions performed, assets used, and risks assumed. This allocation must be supported with external market data reflecting the splitting process of profit in similar circumstances.
Residual analysis: In this case, profits are split into two categories. First, a base remuneration is allocated to each party, employing a traditional Transfer Pricing method or the Transactional Net Margin Method for contributions that can be compared to independent transactions. Then, any residual profit attributable to single contributions or high integration is allocated according to the relative value of these specific contributions.
Determination of the Profits to Be Split
For an accurate application of the method, relevant profits derived from the controlled transaction must be identified. Operating profits are usually considered, but in particular cases of market or production risks, gross profit should be used. A common accounting base must be adopted before combining profits and their expression in a uniform currency.
Criteria for the Profit Split
The profit split must be based on economically valid criteria reflecting the relative contributions of the involved parties by aligning with the Arm’s Length Principle, as set out in section C5 of the Revised Guidance on the Application of the Transactional Profit Split Method.
The factors or criteria used for splitting must comply with the following characteristics:
Independence: They must be unrelated to the internal Transfer Pricing policy and based on objective data, not on figures related to controlled transactions.
Verifiability: The criteria must be verifiable through adequate documentation.
Comparable data support: The allocation must be supported by external comparable data, internal information, or a combination of both.
Selection of Splitting Factors
The correct allocation of profits according to this method requires selecting objective criteria reflecting the relative contributions of each entity. Their selection depends on functional analysis and the transaction context, which must be supportable and verifiable economically.
One of the main factors used is the value of tangible and intangible assets employed by each party. In industries where intellectual property and technology play a determining role, the value of these assets becomes crucial to setting the profit split. In addition, the capital employed in the operation is considered since companies that invest more tend to take on more risk and should, therefore, receive more share of the profits.
Another common criterion is the level of operating expenses incurred by each entity, especially costs related to strategic activities such as research and development and marketing or distribution. In specific industries, the costs of these activities may accurately reflect the level of each company’s contribution to the transaction success.
Conversely, using these factors is not exempt from challenges. Appraising intangibles can sometimes be complex due to the lack of market benchmarks, which the former requires the use of specialized methodologies. Likewise, data used to determine the profit split must come from reliable sources and be consistent with the economic reality of the parties involved.
Challenges in Applying the Method
Despite its advantages, the profit split application has significant challenges:
Complexity in obtaining information: This method requires access to detailed and, often, confidential data from all parties involved in the transaction. Conversely, collecting this information can be complicated, specifically when companies operate in multiple jurisdictions with different tax regulations.
Difficulty in measuring contributions: Accurately quantifying the relative value of each entity’s contributions is a significant challenge, especially when intangible assets such as proprietary technology, trademarks, or specialized know-how are involved. The absence of reliable market benchmarks can lead to subjective estimates, increasing potential discrepancies between companies and tax administrations.
Need for reliable market data: In order to support the allocation of profits under this method, benchmark information on comparable independent-party transactions is essential. Conversely, this information is not always available or may be difficult to obtain. The lack of adequate comparables can lead to increased scrutiny by tax authorities, who may question the methodology employed and require adjustments to the profit allocation.
Due to the complexity of these challenges, companies adopting the profit split method should ensure detailed documentation and well-founded economic studies to support their approach. In addition, implementing advanced data analysis tools and the support of specialized consultants can be crucial to mitigate risks and ensure compliance with Transfer Pricing regulations in each jurisdiction they operate in.
Conclusion
The profit split method is valuable in Transfer Pricing, especially in transactions where the parties are closely integrated or bring unique and worthy elements. Its correct application ensures a fair allocation of profits, according to the Arm’s Length Principle, and reduces tax risks and potential disputes among tax jurisdictions.
Read More
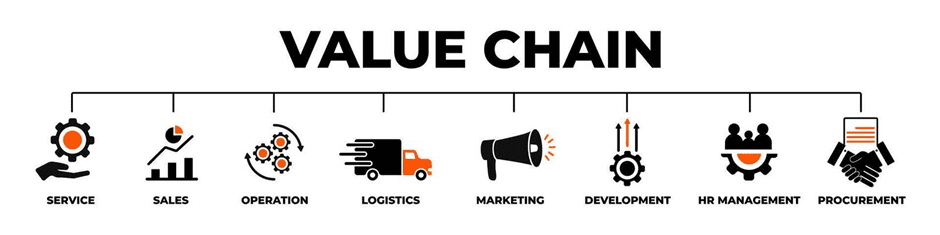
Value Chain Analysis: Aligning Profits with Functions and Risks
Value Chain Analysis: Aligning Profits with Functions and Risks
Introduction
The OECD emphasizes aligning transfer pricing outcomes with value creation. Value Chain Analysis (VCA) plays a key role in determining how profits should be allocated among group entities based on their contribution.
What is VCA?
Mapping of functions, assets, and risks (FAR) across all entities in a multinational enterprise (MNE).
Identifies key value drivers and profit-generating activities.
Importance in OECD TP Framework
Central to BEPS Action 8–10.
Determines which entity should retain residual profits or bear losses.
Steps in Conducting VCA
Identify significant functions and economic contributions.
Evaluate the role of intangibles and capital.
Compare contractual terms with actual conduct.
Align TP methods with business substance.
Relevance in India
Value chain is a key focus in APA and audit proceedings.
Increasing scrutiny on DEMPE analysis in intangibles-heavy sectors.
Conclusion
Value Chain Analysis brings transparency and integrity to TP policies. It ensures that profit attribution mirrors real economic activity, a principle strongly reinforced by OECD and Indian tax authorities.
Introduction
The OECD emphasizes aligning transfer pricing outcomes with value creation. Value Chain Analysis (VCA) plays a key role in determining how profits should be allocated among group entities based on their contribution.
What is VCA?
Mapping of functions, assets, and risks (FAR) across all entities in a multinational enterprise (MNE).
Identifies key value drivers and profit-generating activities.
Importance in OECD TP Framework
Central to BEPS Action 8–10.
Determines which entity should retain residual profits or bear losses.
Steps in Conducting VCA
Identify significant functions and economic contributions.
Evaluate the role of intangibles and capital.
Compare contractual terms with actual conduct.
Align TP methods with business substance.
Relevance in India
Value chain is a key focus in APA and audit proceedings.
Increasing scrutiny on DEMPE analysis in intangibles-heavy sectors.
Conclusion
Value Chain Analysis brings transparency and integrity to TP policies. It ensures that profit attribution mirrors real economic activity, a principle strongly reinforced by OECD and Indian tax authorities.
Read More

Luxembourg Implements OECD’s Pillar Two: Global Minimum Tax in Focus
Luxembourg Implements OECD’s Pillar Two: Global Minimum Tax in Focus
Luxembourg has demonstrated its commitment to international tax transparency by taking proactive steps to implement the OECD’s Pillar Two framework. This initiative establishes a 15% global minimum tax rate for multinational enterprises (MNEs) with annual revenues exceeding EUR 750 million. The framework aims to address base erosion and profit shifting (BEPS) while ensuring that profits are taxed where economic activity occurs.
Through legislative amendments and careful alignment with OECD guidance, Luxembourg has positioned itself as a leader in adopting these international standards, ensuring compliance with both EU directives and global tax policies.
Key Developments and Timeline
Initial Implementation:
Following the EU’s adoption of the Pillar Two directive in December 2022, Luxembourg introduced a draft bill on 4 August 2023 to transpose these rules into domestic law.
This legislation applies to fiscal years starting on or after 31 December 2023, bringing Luxembourg in line with the EU-mandated timeline.
Incorporation of OECD Guidance:
On 13 November 2023, Luxembourg amended the bill to include additional OECD administrative guidance issued in February and July 2023.
These updates introduced key transitional measures, such as safe harbors for compliance, based on country-by-country reporting data.
Final Legislative Updates:
Further amendments were proposed on 12 June 2024 to align with OECD administrative guidance issued in early 2024.
Luxembourg’s legislation now integrates detailed rules, including adjustments to the treatment of investment entities and real estate vehicles.
Key Features of the Luxembourg Legislation
Scope of Application:
The rules target multinational groups with consolidated annual revenues exceeding EUR 750 million. Certain entities, such as investment funds and real estate investment vehicles, are excluded from the framework.
Transitional Safe Harbors:
Temporary relief is provided during the initial implementation period, relying on country-by-country reporting (CbCR) data to simplify compliance.
Alignment with OECD GloBE Rules:
Luxembourg’s legislation explicitly incorporates the OECD’s Global Anti-Base Erosion (GloBE) rules to ensure consistency with international standards.
Clarifications for Specific Entities:
Definitions and conditions for the inclusion or exclusion of certain entities, including investment funds and REITs, have been refined to prevent misinterpretation.
Implications for Multinational Enterprises
Luxembourg’s Pillar Two legislation introduces a range of challenges and opportunities for multinational enterprises:
Compliance Obligations:
MNEs must reassess their organizational structures, tax strategies, and reporting frameworks to align with the new rules.
Increased Reporting Demands:
Enhanced documentation requirements will necessitate greater transparency and detailed records to substantiate compliance.
Strategic Impact on Investments:
The introduction of a global minimum tax may affect decisions on financing, investments, and corporate restructuring.
Conclusion
Luxembourg’s proactive adoption of Pillar Two demonstrates its commitment to fostering fair tax practices while maintaining its reputation as a leading financial hub. Multinational enterprises operating in or through Luxembourg must prepare for this new tax environment by reassessing strategies and ensuring compliance with both local and global requirements.
Luxembourg has demonstrated its commitment to international tax transparency by taking proactive steps to implement the OECD’s Pillar Two framework. This initiative establishes a 15% global minimum tax rate for multinational enterprises (MNEs) with annual revenues exceeding EUR 750 million. The framework aims to address base erosion and profit shifting (BEPS) while ensuring that profits are taxed where economic activity occurs.
Through legislative amendments and careful alignment with OECD guidance, Luxembourg has positioned itself as a leader in adopting these international standards, ensuring compliance with both EU directives and global tax policies.
Key Developments and Timeline
Initial Implementation:
Following the EU’s adoption of the Pillar Two directive in December 2022, Luxembourg introduced a draft bill on 4 August 2023 to transpose these rules into domestic law.
This legislation applies to fiscal years starting on or after 31 December 2023, bringing Luxembourg in line with the EU-mandated timeline.
Incorporation of OECD Guidance:
On 13 November 2023, Luxembourg amended the bill to include additional OECD administrative guidance issued in February and July 2023.
These updates introduced key transitional measures, such as safe harbors for compliance, based on country-by-country reporting data.
Final Legislative Updates:
Further amendments were proposed on 12 June 2024 to align with OECD administrative guidance issued in early 2024.
Luxembourg’s legislation now integrates detailed rules, including adjustments to the treatment of investment entities and real estate vehicles.
Key Features of the Luxembourg Legislation
Scope of Application:
The rules target multinational groups with consolidated annual revenues exceeding EUR 750 million. Certain entities, such as investment funds and real estate investment vehicles, are excluded from the framework.
Transitional Safe Harbors:
Temporary relief is provided during the initial implementation period, relying on country-by-country reporting (CbCR) data to simplify compliance.
Alignment with OECD GloBE Rules:
Luxembourg’s legislation explicitly incorporates the OECD’s Global Anti-Base Erosion (GloBE) rules to ensure consistency with international standards.
Clarifications for Specific Entities:
Definitions and conditions for the inclusion or exclusion of certain entities, including investment funds and REITs, have been refined to prevent misinterpretation.
Implications for Multinational Enterprises
Luxembourg’s Pillar Two legislation introduces a range of challenges and opportunities for multinational enterprises:
Compliance Obligations:
MNEs must reassess their organizational structures, tax strategies, and reporting frameworks to align with the new rules.
Increased Reporting Demands:
Enhanced documentation requirements will necessitate greater transparency and detailed records to substantiate compliance.
Strategic Impact on Investments:
The introduction of a global minimum tax may affect decisions on financing, investments, and corporate restructuring.
Conclusion
Luxembourg’s proactive adoption of Pillar Two demonstrates its commitment to fostering fair tax practices while maintaining its reputation as a leading financial hub. Multinational enterprises operating in or through Luxembourg must prepare for this new tax environment by reassessing strategies and ensuring compliance with both local and global requirements.
Read More

Advance Pricing Agreements (APAs) – Reducing TP Uncertainty
Advance Pricing Agreements (APAs) – Reducing TP Uncertainty
Introduction
APAs provide certainty in transfer pricing by pre-agreeing methods for related-party transactions. Supported by the OECD and implemented by many tax administrations including India, APAs are a practical dispute-avoidance tool.
Types of APAs
Unilateral: Between taxpayer and one tax authority
Bilateral: Involving tax authorities of both transaction jurisdictions
Multilateral: Covers three or more jurisdictions
OECD and Indian Framework
India’s APA program is robust and follows OECD standards.
APA statistics show strong uptake in sectors like IT/ITES, pharma, and financial services.
Benefits
Certainty on pricing for 5+ years
Protection from double taxation
Reduced risk of audits and litigation
Alignment with global transfer pricing best practices
Practical Tips for Success
Start early with pre-filing consultation
Ensure robust FAR analysis
Demonstrate consistency and transparency
Align APA strategy with global policy
Conclusion
An APA is a strategic investment in certainty and tax risk management. With increasing scrutiny, entering into APAs is a proactive move for transfer pricing peace of mind.
Introduction
APAs provide certainty in transfer pricing by pre-agreeing methods for related-party transactions. Supported by the OECD and implemented by many tax administrations including India, APAs are a practical dispute-avoidance tool.
Types of APAs
Unilateral: Between taxpayer and one tax authority
Bilateral: Involving tax authorities of both transaction jurisdictions
Multilateral: Covers three or more jurisdictions
OECD and Indian Framework
India’s APA program is robust and follows OECD standards.
APA statistics show strong uptake in sectors like IT/ITES, pharma, and financial services.
Benefits
Certainty on pricing for 5+ years
Protection from double taxation
Reduced risk of audits and litigation
Alignment with global transfer pricing best practices
Practical Tips for Success
Start early with pre-filing consultation
Ensure robust FAR analysis
Demonstrate consistency and transparency
Align APA strategy with global policy
Conclusion
An APA is a strategic investment in certainty and tax risk management. With increasing scrutiny, entering into APAs is a proactive move for transfer pricing peace of mind.
Read More
Ready to Elevate Your Brand?
Ready to Elevate Your Brand?
Ready to Elevate Your Brand?
Let’s team up and turn your vision into results.
Let’s team up and turn your vision into results.
Let’s team up and turn your vision into results.